
Modern mathematical libraries offer powerful tools for data analysis and signal processing. Among these is Alglib, a versatile library that provides numerical computing capabilities, including Fast Fourier Transform (FFT). In this post, we explore how to integrate Alglib with NinjaTrader 8 to build a custom indicator. Below, we outline the prerequisites and provide step-by-step instructions for setting up the Alglib library and using it in your NinjaTrader 8 environment.
Requirements
- Alglib Library: Download the library from Alglib's official website.
- NinjaTrader 8: Starting with version 8.
- C# Programming Knowledge: Familiarity with NinjaScript and basic C# is recommended.
Setting Up the Alglib Library
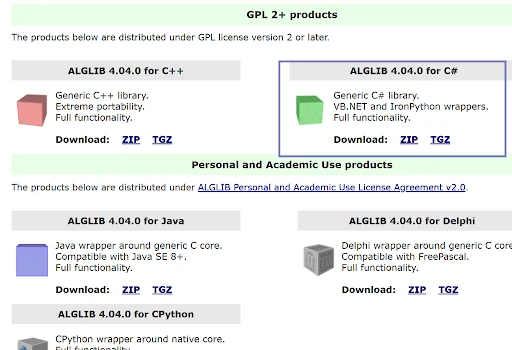
1. Download Alglib:
- Visit https://www.alglib.net/ and download the latest version of the library for C#.
- Extract the library files to a convenient location on your computer.
2. Add Alglib to NinjaTrader:
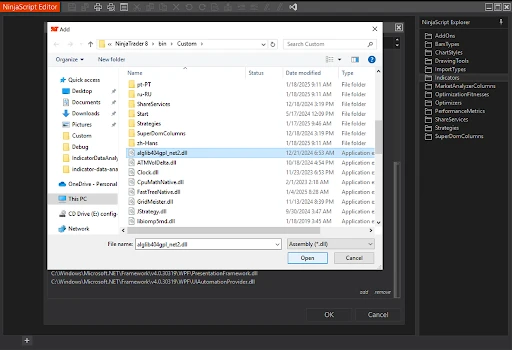
- Copy the
alglib404gpl_net2.dllfile to theDocuments\NinjaTrader 8\bin\Customfolder. - In NinjaScript Editor, add the
alglib404gpl_net2.dllfile to your project by right-clicking, selecting Reference.
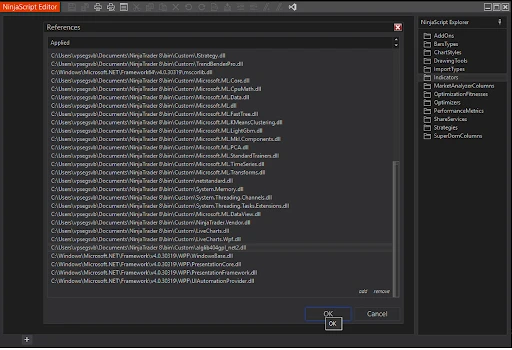
3. Verify Installation:
- Compile the script to ensure the library is properly linked.
4. Explore Documentation:
- Open the extracted Alglib archive and locate the manual.csharp.html file. This file contains detailed descriptions of methods and examples.
- Find Example 8.4 in the
FastTransformspackage.
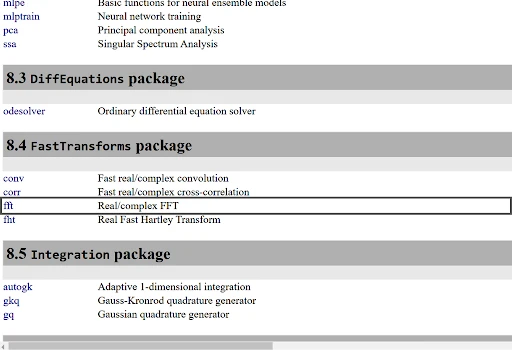
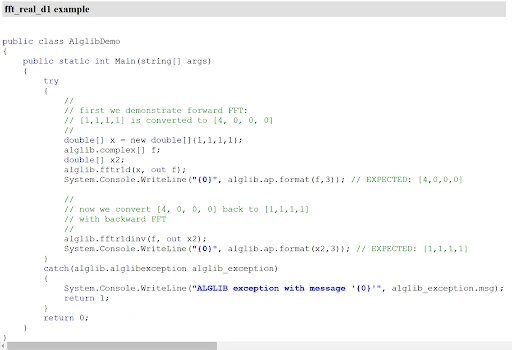
- Navigate to the fft section and select the example fft_real_d1 (Real FFT: simple example), which will be the basis for building our indicator.
What is FFT?
FFT, or Fast Fourier Transform, is an algorithm that transforms a signal from the time domain into the frequency domain. By analyzing these frequency components, traders can:
- Detect dominant market cycles.
- Identify repetitive patterns in price movements.
- Filter out noise and focus on significant trends.
How FFT Works
- Input Signal: A sequence of data points representing market prices, indicator values, or other relevant market metrics over time.
- Transformation: The FFT algorithm computes the signal's amplitude and phase for different frequencies.
- Output: A frequency spectrum that shows the signal's strength at various frequencies.
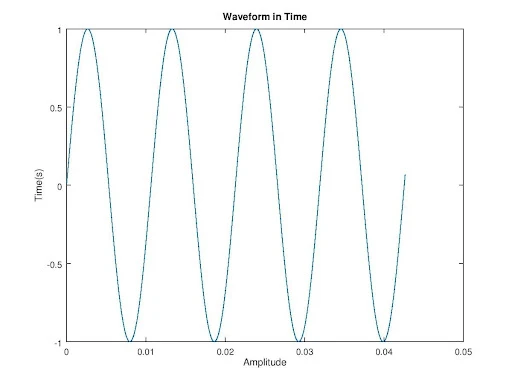
Here is a conceptual diagram of how FFT transforms time-series data:
Implementing FFT in NinjaTrader 8
Building on the Alglib library’s robust numerical algorithms, we will demonstrate its use in implementing a custom FFT-based indicator. Alglib’s versatility makes it an excellent choice for signal processing tasks within NinjaTrader 8.
Key Features of the Indicator
- Input Parameters:
Period:The number of bars used for FFT calculations.Noise:The level of high-frequency filtering applied to remove noise.
Output:- A smoothed time-domain signal based on dominant frequency components.
- Plots the FFT results on the chart for visual analysis.
Code Walkthrough
Below is a step-by-step explanation of the FFT Transform indicator:
1. Initialization
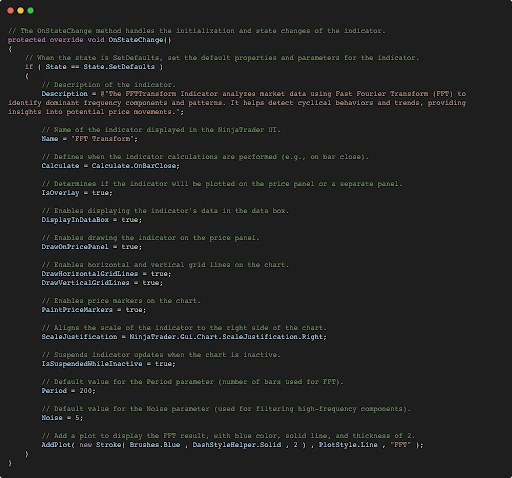
The OnStateChange method initializes the indicator, sets its default parameters, and adds a plot to visualize the FFT output on the chart. For more details, you can refer to the official NinjaTrader documentation on OnStateChange here. Below is a detailed explanation of the parameters and the AddPlot method used in this implementation:
Parameters
- Description: A brief explanation of what the indicator does.
- Name: The display name of the indicator in the NinjaTrader interface.
- Calculate: Determines when calculations are performed. Available options include:
OnEachTick: Executes calculations on every tick of market data.OnBarClose: Executes calculations at the close of each bar.OnPriceChange: Executes calculations whenever the price changes.
- IsOverlay: Indicates whether the indicator is plotted on the price panel or a separate panel.
- Period: Defines the number of bars used for the FFT calculation.
- Noise: A parameter to filter out high-frequency components and reduce noise.
AddPlot Method
The AddPlot method is used to configure the visual representation of the indicator's output:
- Stroke: Specifies the appearance of the plot line, including color, style, and thickness.
- PlotStyle: Defines the style of the plot (e.g., line, bar).
- Label: A label for the plot, displayed in the chart's legend.
Below is the AddPlot configuration in the indicator:
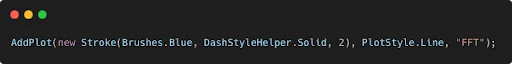
Brushes.Blue: Sets the color of the plot to blue.DashStyleHelper.Solid: Uses a solid line style.2: Sets the thickness of the plot line.PlotStyle.Line:Specifies that the plot is a line."FFT": Provides the label "FFT" for the plot in the chart legend.
This setup ensures that the FFT results are clearly visible on the chart, aiding in analysis and interpretation of the data.
2. Main Calculation Logic
The OnBarUpdate method executes the core FFT transformation and filtering logic. For a complete understanding of how this method works and its capabilities, refer to the official NinjaTrader documentation on OnBarUpdate here.
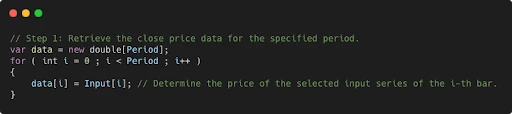
Prepare Data: Retrieve the input data for the specified Period. Using Input as the data source allows users to specify any data series when configuring the indicator parameters. This flexibility means the FFT calculations can be applied to various series, such as price, volume, or the output of another indicator, enabling broader analytical possibilities.
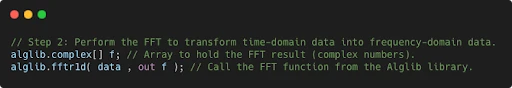
Apply FFT: Transform the time-domain data into the frequency domain.
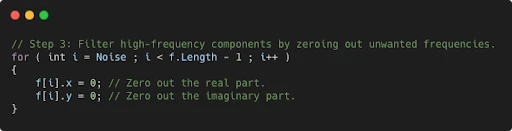
Filter Noise: Zero out high-frequency components by setting their real (x) and imaginary (y) parts to zero. These components represent less significant or high-frequency fluctuations in the frequency domain that do not contribute to meaningful patterns in the time-domain signal. Removing them ensures the output focuses on dominant and relevant frequencies, enhancing the indicator's ability to highlight major trends and cycles.
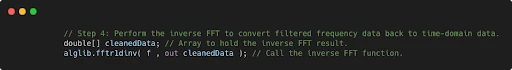
Inverse FFT: Transform the filtered frequency data back into the time domain.
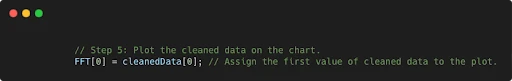
Plot Results: Display the cleaned signal on the chart.
3. Parameters and Properties
Noise: Controls the level of frequency filtering. A higher value filters more noise but may remove significant details.Period: Defines the number of bars used for FFT calculations.
Visualizing the Results
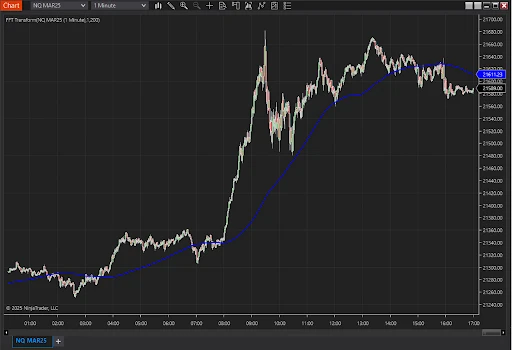
The FFT Transform indicator is a smoothed line on a price chart that removes price noise and emphasizes trends. To demonstrate it, below showcased two examples:
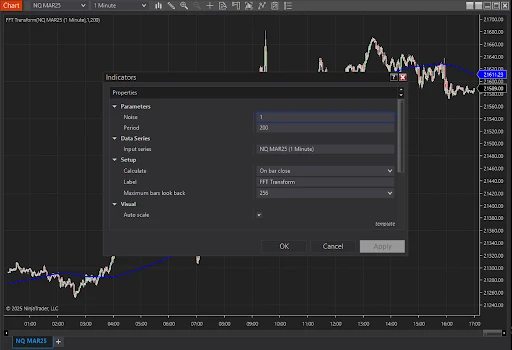
1. Smoothing Price Data: The first FFT example is applied to NQ futures price data. This example shows how the indicator can smooth raw price series and identify dominant market trends.
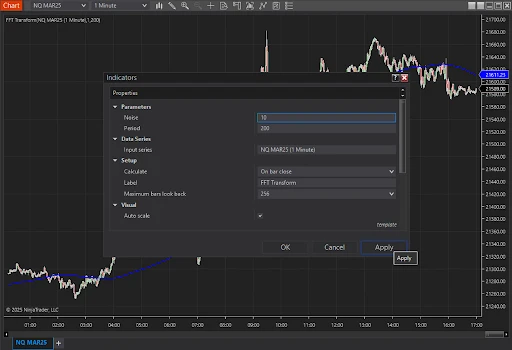
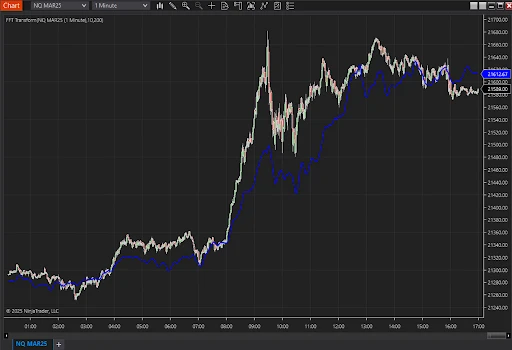
The amount of smoothing depends on the Noise parameter—lower values result in more noise being filtered out, leading to greater smoothing of the data.
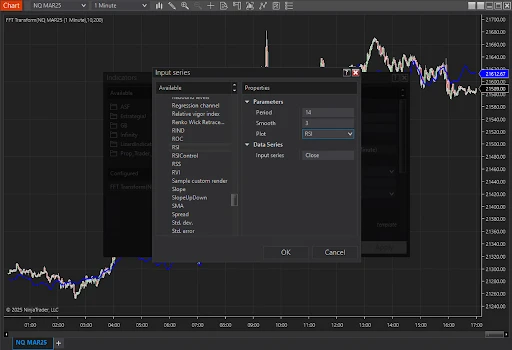
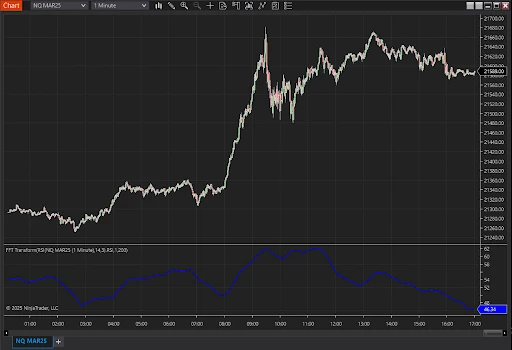
2. Smoothing RSI Data: This example uses RSI (Relative Strength Index) as the Input series. By applying FFT to the RSI data, the indicator effectively transforms and visualizes patterns within the RSI values, helping to identify key frequencies.
Summary
The FFT Transform indicator leverages the power of Fast Fourier Transform to uncover market cycles and trends. By filtering out noise and focusing on dominant frequencies, this tool provides valuable insights for traders seeking to understand market behavior. Experiment with different Noise and Period values to see their impact on the results. Consider integrating this indicator into a broader trading strategy or combining it with other indicators to enhance analytical capabilities.
Resources
- Alglib Library: Download and explore the Alglib library.
- NinjaTrader Developer Documentation: Learn more about creating custom indicators.
- Download the FFT Transform Indicator: Access the custom indicator built as part of this article.
- Download the Visual Studio Project Template: Download a sample visual studio project to use as a template.
Thank you for exploring the FFT Transform indicator. Use these insights to enhance your NinjaTrader 8 experience, and apply the concepts to develop innovative indicators or strategies tailored to your trading needs.
