
Introduction
Data visualization can transform raw information into powerful insights. NinjaTrader 8 offers endless possibilities for enhancing your trading experience by integrating visually rich tools. In this guide, we’ll explore how to utilize one such tool, LiveCharts, to bring your data to life.
What We'll Cover
- Setting Up the Project: Adding the necessary components and dependencies.
- Implementing the Add-On: Step-by-step code walkthrough.
- Visualizing the Data: Using a list of accounts and their cumulative cash balances as an example to demonstrate data presentation.
Setting Up the Project
Requirements
- NinjaTrader 8.1.4.0
- Visual Studio 2022
- LiveCharts library
- LiveCharts.Wpf library
- Basic knowledge of C# and NinjaScript
Installation Steps
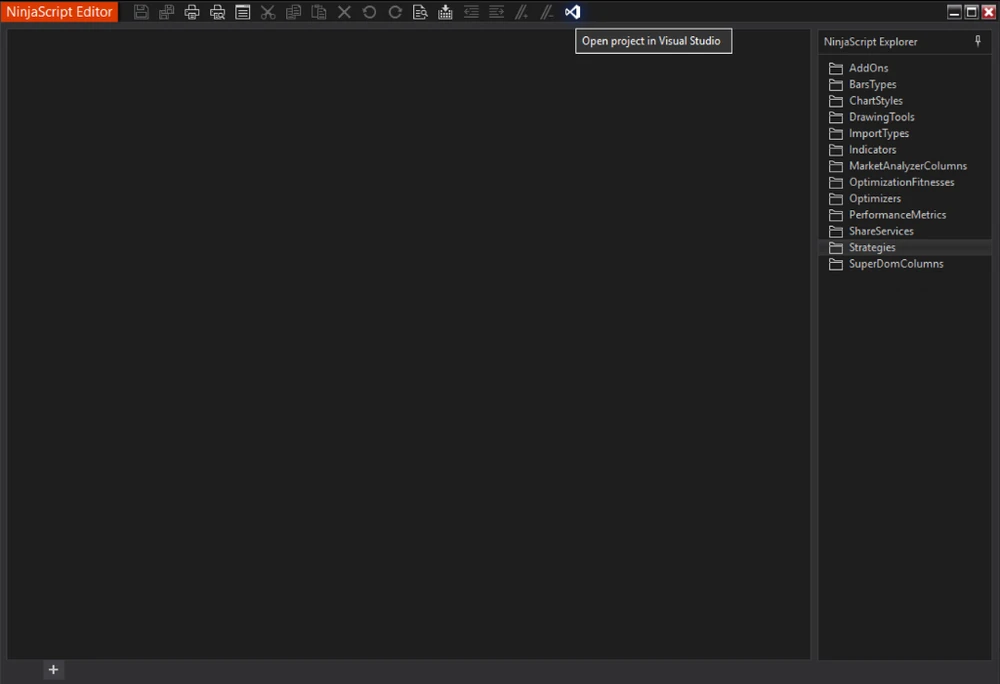
- If Visual Studio is installed, you can open it directly from the NinjaScript Editor in NinjaTrader 8 by clicking on the Visual Studio icon. This will automatically load your NinjaTrader project, simplifying the setup process.
2. In the Solution Explorer, right-click on the project and select Manage NuGet Packages.
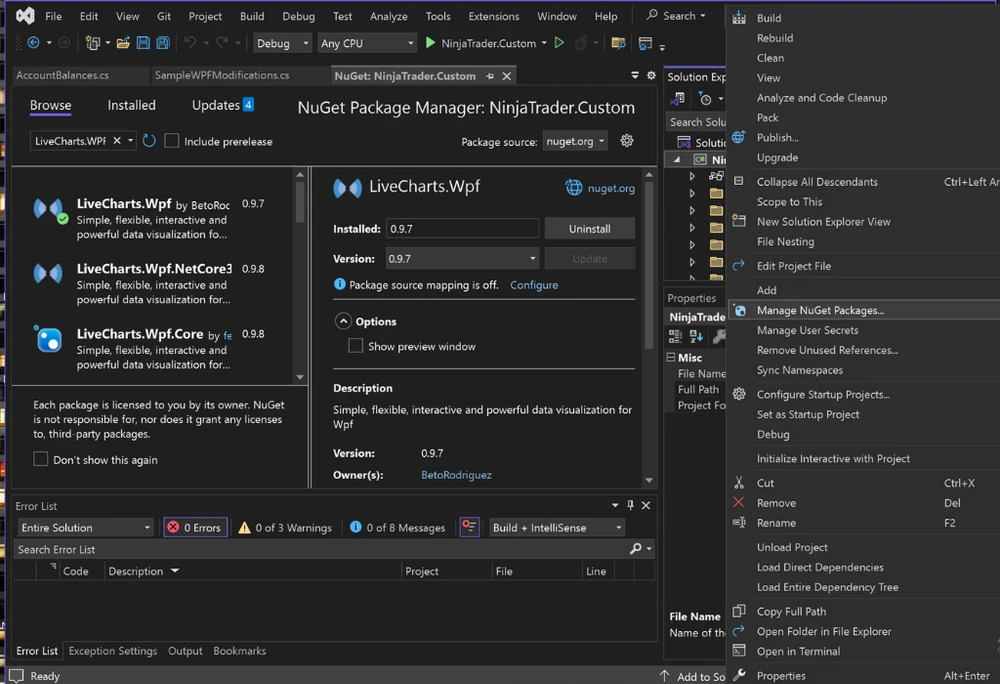
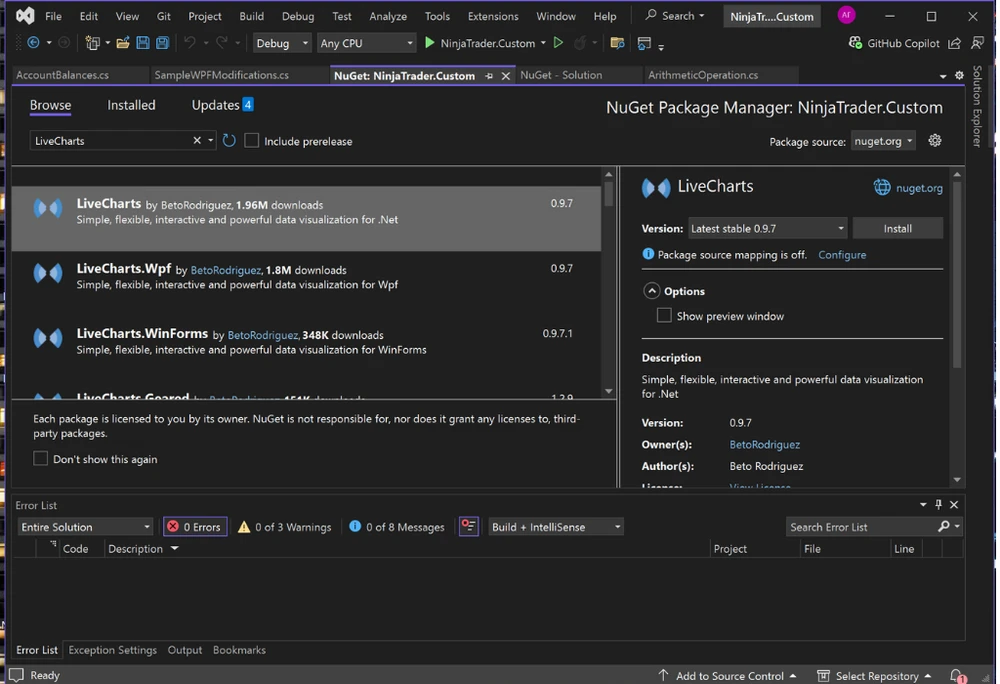
3. Search for LiveCharts and LiveCharts.Wpf, then install both packages.
4. Once installed, locate the packages folder in your project directory.
5. Copy the DLL files for LiveCharts and LiveCharts.Wpf from the packages folder to the Documents\NinjaTrader 8\bin\Custom directory on your computer.
6. Open NinjaTrader 8 and navigate to the NinjaScript Editor.
7. Right-click in the NinjaScript Editor and select References.
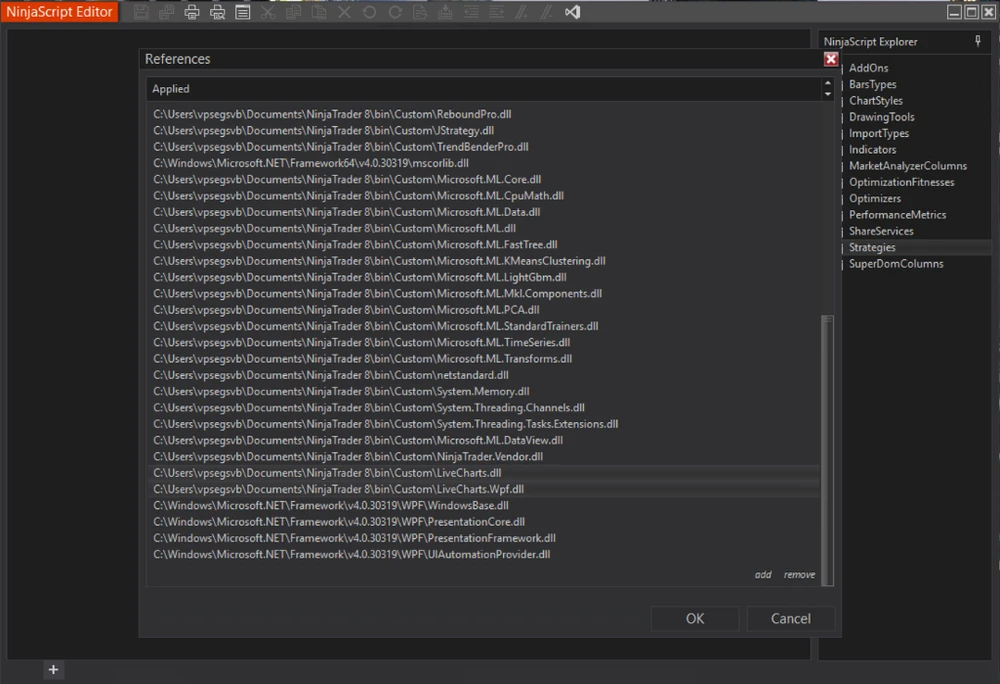
8. Use the Add button to add references to the copied DLL files from the Documents\NinjaTrader 8\bin\Custom directory.
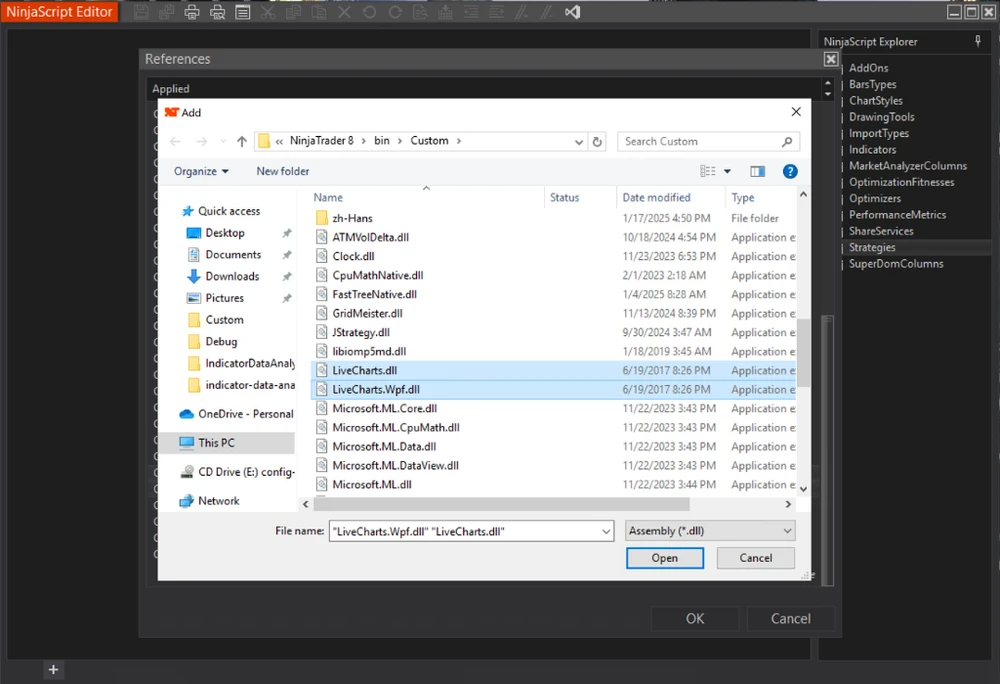
9. After adding the references, you can proceed to use the libraries in your NinjaScript projects.
Code Implementation
1. Creating the Add-On Class
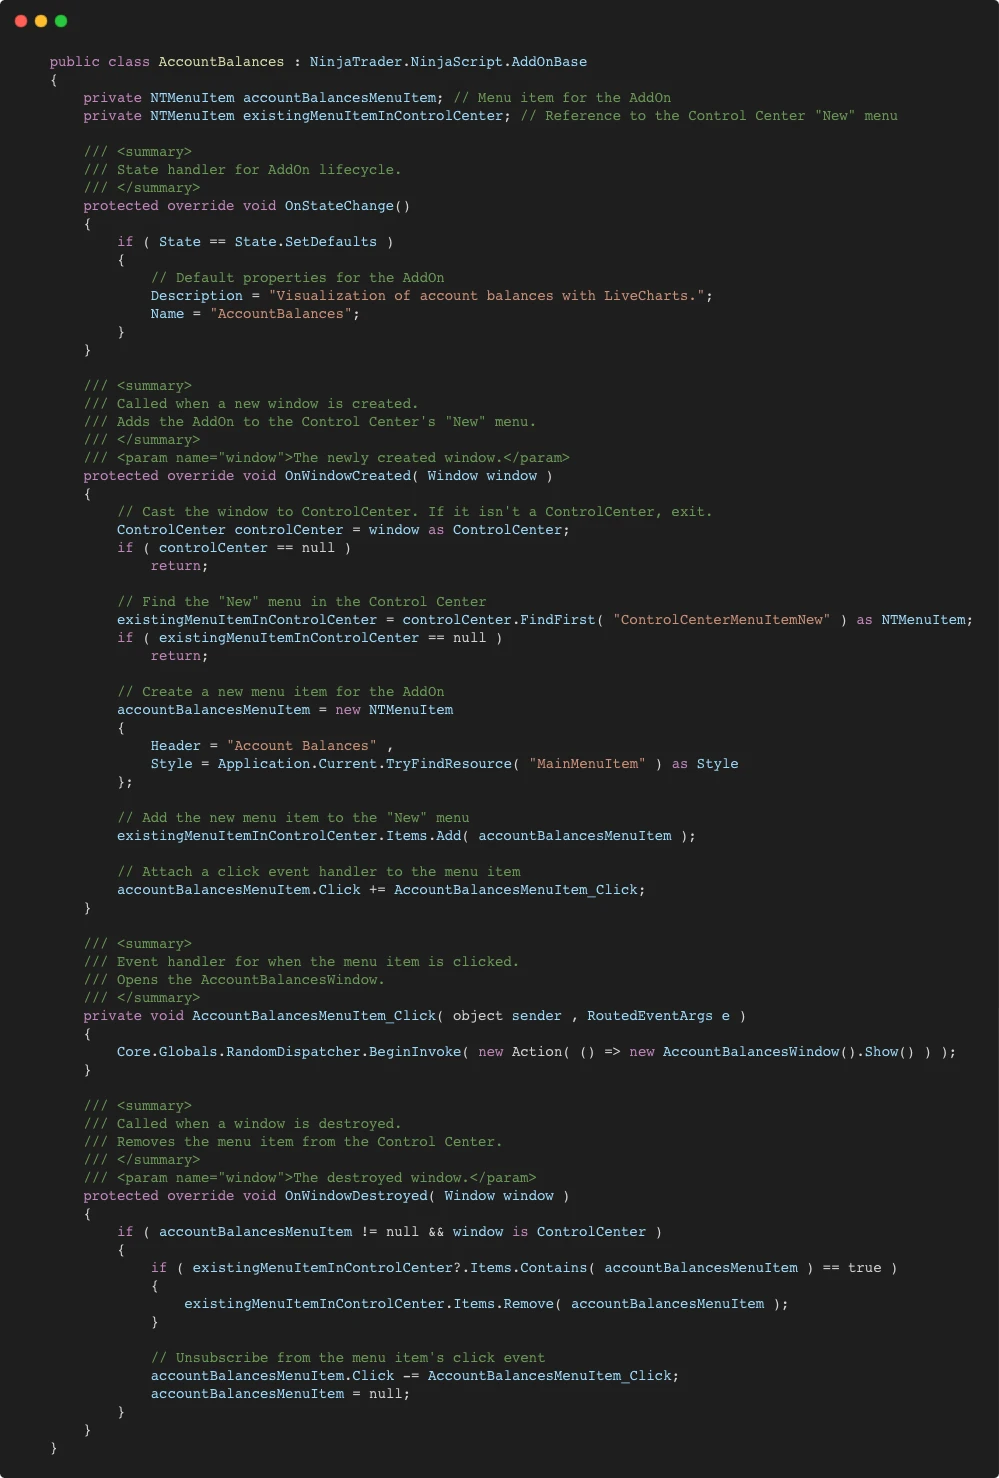
The main add-on logic resides in a class that inherits from NinjaTrader.NinjaScript.AddOnBase. This ensures integration with NinjaTrader's framework.
Explanation
- OnStateChange: This method initializes the add-on. The State.SetDefaults case is where you define default properties, such as the name and description of your add-on. It ensures the add-on integrates seamlessly with NinjaTrader's infrastructure.
- OnWindowCreated: This method runs when a new NinjaTrader window is created. It checks if the window is a Control Center window and, if so, adds a new menu item labeled "Account Balances" to the Control Center's "New" menu. This integration is key to making your add-on accessible to users.
- OnWindowDestroyed: This method cleans up after your add-on. When a window is destroyed, it removes the "Account Balances" menu item from the Control Center's menu, ensuring no leftover references that could cause errors.
- AccountBalancesMenuItem_Click: This event handler triggers when the "Account Balances" menu item is clicked. It creates and opens the custom AccountBalancesWindow using NinjaTrader's RandomDispatcher to manage UI threading effectively.
2. Designing the Custom Window
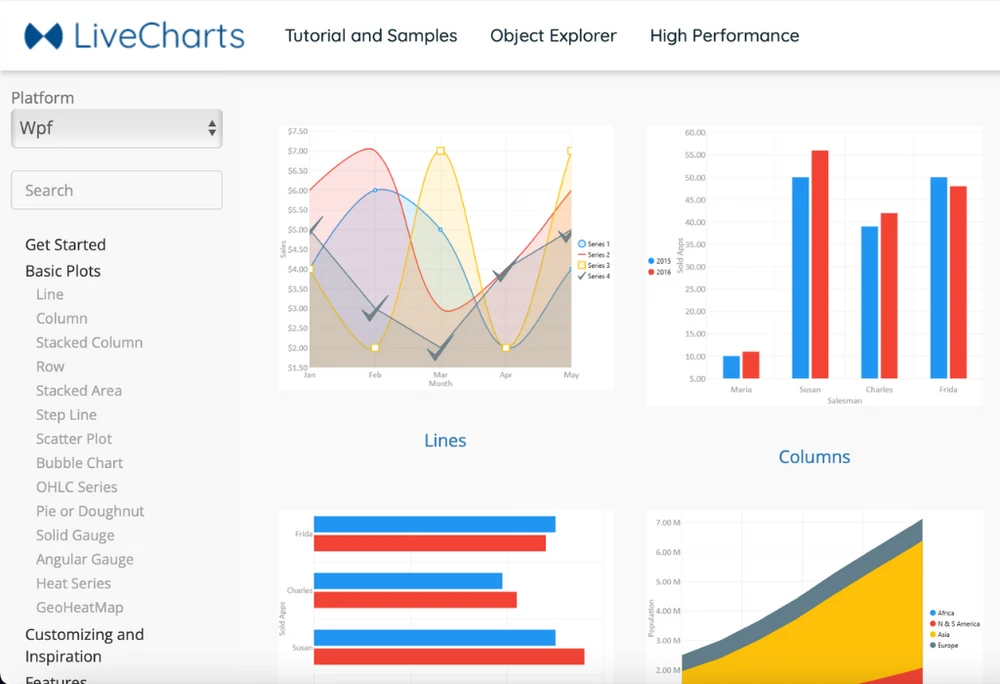
We chose two chart types—pie and line—for their clarity and ability to convey complementary data insights. Pie charts provide an intuitive, percentage-based representation of account balances, while line charts excel at illustrating the cumulative balance across all accounts, providing a clear view of the total cash value trend. To accommodate both charts in an aesthetically pleasing layout, we set the window width to 1200. For more chart options and inspirations, visit LiveCharts.
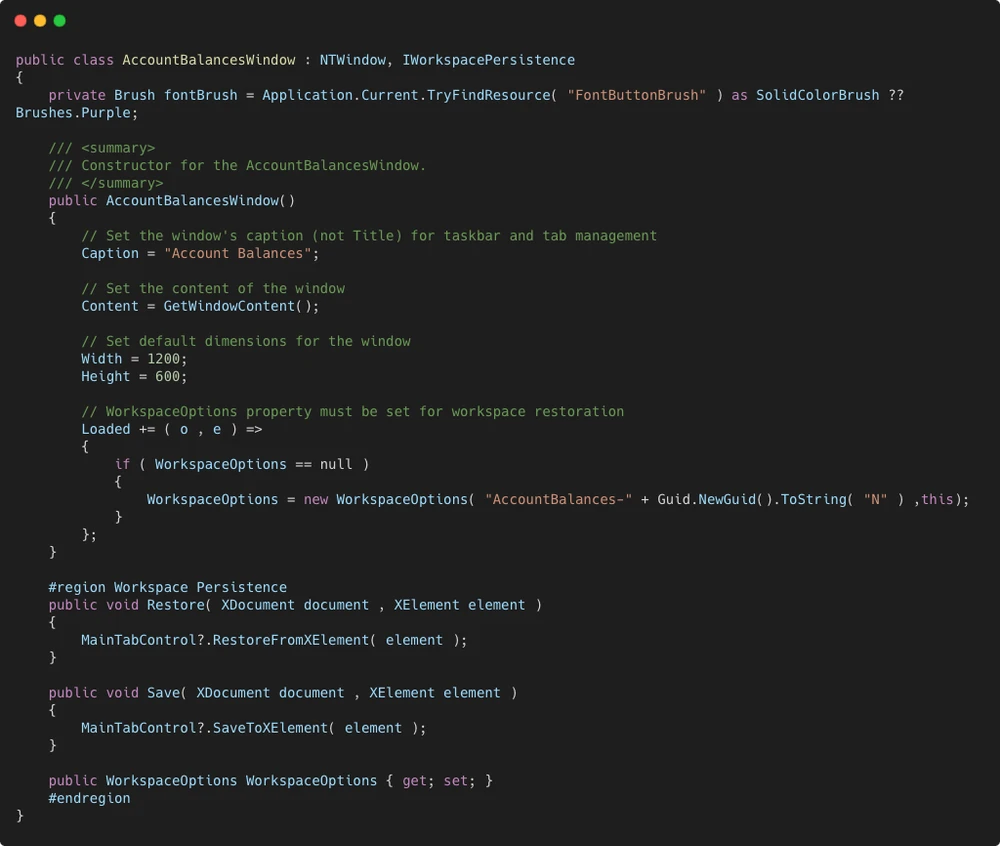
The AccountBalancesWindow class creates a window to display the charts. It inherits from NTWindow and implements IWorkspacePersistence to support workspace saving and loading.
Explanation
- Caption: Sets the title of the window, which appears in the taskbar and for tab management. This helps users identify the purpose of the window easily.
- fontBrush Initialization: The
fontBrushis initialized to retrieve a specific resource from the current application, "FontButtonBrush." If this resource is not found, it defaults toBrushes.Purple. This ensures a consistent appearance or fallback color for text in the charts. - Content: The
Contentproperty links to theGetWindowContent() method, which creates the charts and their layout. By setting this property, the window is visually populated when opened. - Width and Height: The window's dimensions are set to 1200x600, ensuring that both charts (pie and line) fit neatly and are visually balanced.
- WorkspaceOptions: This property manages the add-on's workspace restoration. The
Loadedevent ensures that a unique workspace ID is generated using a GUID when the window is loaded. This functionality allows the window's state to be saved and restored seamlessly during user sessions. - Additional Customization: NinjaTrader windows come with a wide range of customizable properties. Developers can adjust parameters such as resizing behavior, background colors, and additional event handling to tailor the window to specific needs, making it highly adaptable to different scenarios.
3. Creating the Charts
Below is the implementation of the GetWindowContent() method, which creates and configures the Pie chart and Cartesian chart (line chart):
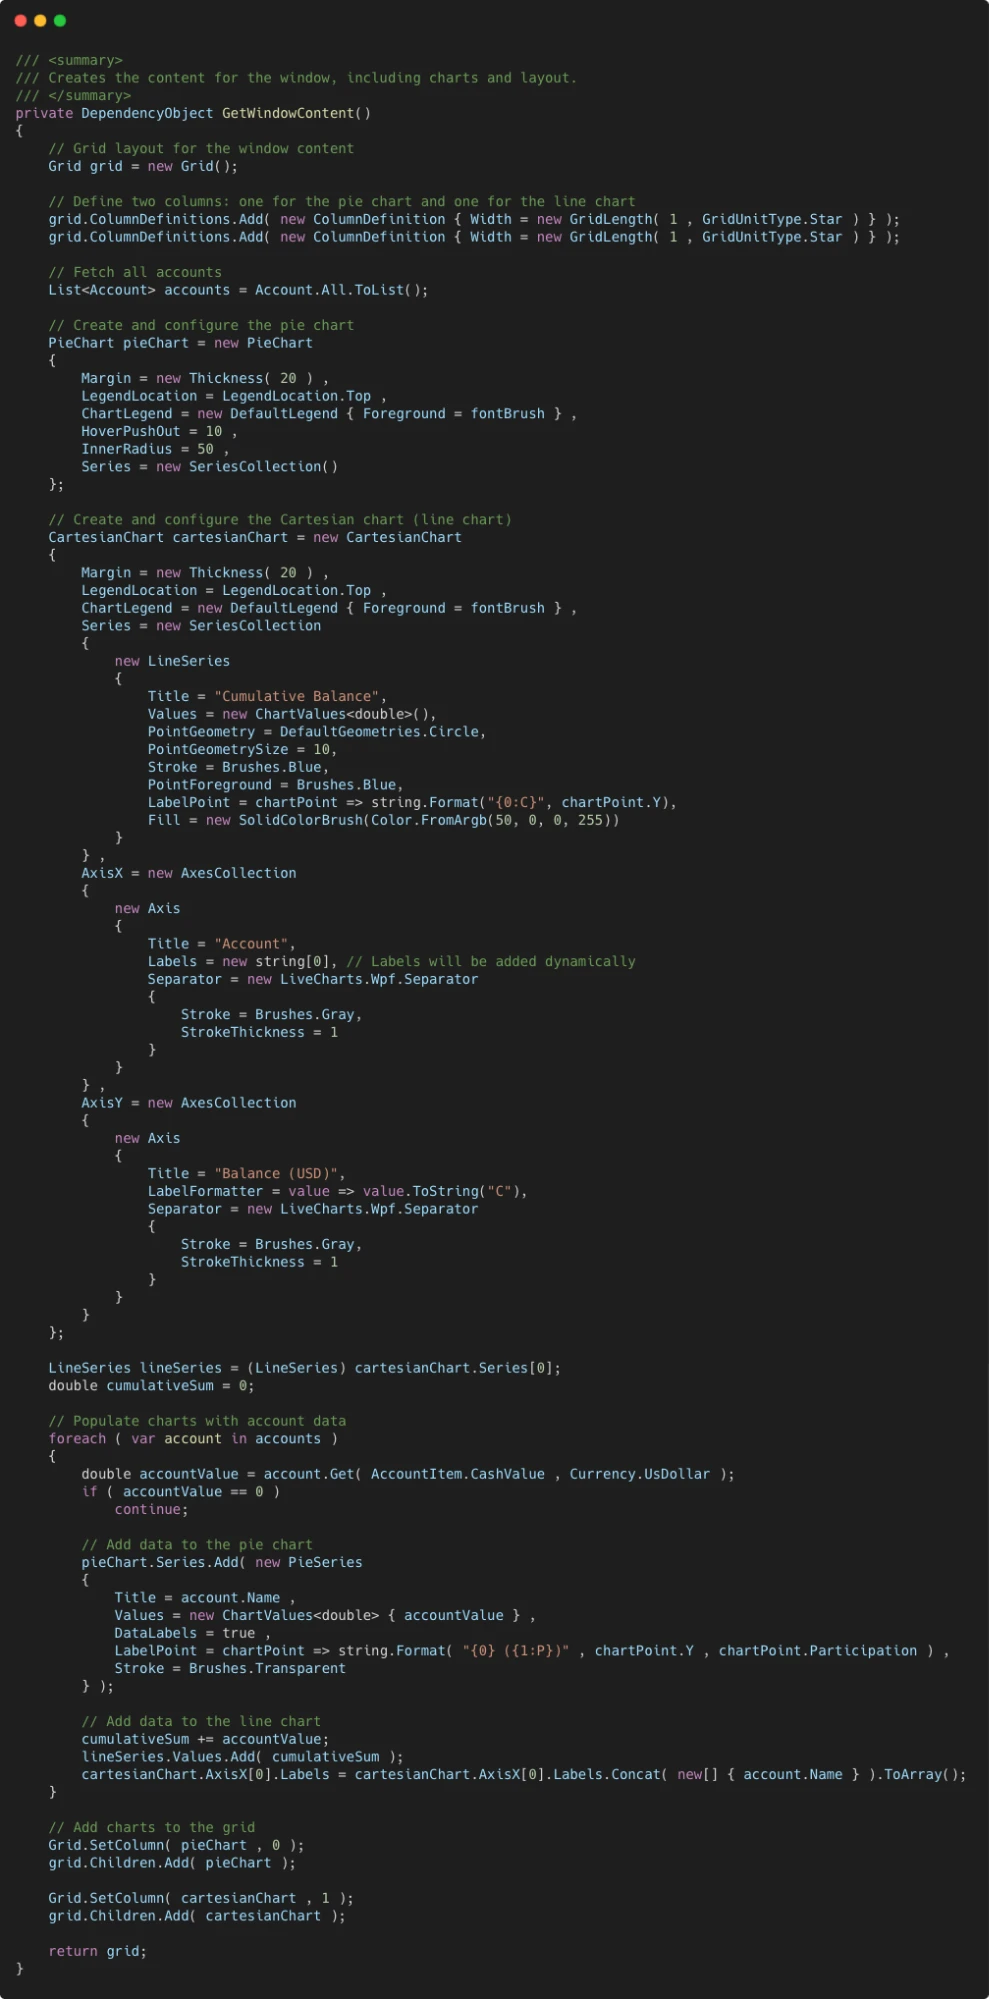
Explanation
- Grid Layout: The grid divides the window into two equal sections, ensuring each chart (pie and line) has its own space. This layout is created with two columns defined by
GridLength(1, GridUnitType.Star), which equally distributes the available space. - Pie Chart:
- Legend Location: Positioned at the top (
LegendLocation.Top) for clarity. - Hover Effects: Adds interactivity by enlarging chart slices slightly when hovered (
HoverPushOut = 10). - Inner Radius: Set to 50 to create a donut-style chart (
InnerRadius = 50). - Series Data: Dynamically populated with account balances, where each slice represents an account’s proportion relative to the total balance.
- LabelPoint: Formats slice labels to show the balance amount and percentage, e.g.,
$1000 (10%).
- Legend Location: Positioned at the top (
- Line Chart (CartesianChart):
- LineSeries: Displays the cumulative account balance over all accounts. The line is styled with:
- PointGeometry: Circular markers (
PointGeometry = DefaultGeometries.Circle) with a size of 10. - Stroke: A blue outline to make the line visually distinct (
Stroke = Brushes.Blue). - LabelPoint: Formats point values as currency, e.g.,
$2000. - Fill: A translucent blue area under the line adds depth (
Fill = new SolidColorBrush(Color.FromArgb(50, 0, 0, 255))).
- PointGeometry: Circular markers (
- Axes Configuration:
- X-Axis: Labeled dynamically with account names (
cartesianChart.AxisX[0].Labels), and separators are styled with a gray stroke. - Y-Axis: Configured to display balances in currency format (
value => value.ToString("C")) with separators styled similarly to the X-Axis.
- X-Axis: Labeled dynamically with account names (
- LineSeries: Displays the cumulative account balance over all accounts. The line is styled with:
- Data Population:
- The method iterates through the list of all accounts (
Account.All.ToList()), filtering out accounts with zero balances. - Pie Chart Data: Adds each account’s balance as a new
PieSeriesentry, whereDataLabelsensures labels are visible. - Line Chart Data: Calculates the cumulative balance by adding each account’s balance to a running total and updates the
Valuescollection of theLineSeries. The X-Axis labels are updated dynamically to include the account names.
- The method iterates through the list of all accounts (
Each chart is added to the Grid as a Children element using grid.Children.Add(), which places them in their respective columns defined earlier. The method concludes by returning the fully configured grid, which serves as the content for the window.
It’s important to note that LiveCharts provides a wide range of properties and parameters for customization. Developers can fine-tune the appearance and behavior of each chart to match their desired style or specific use case, making this library highly versatile for data visualization.
Visualizing the Data
After successfully developing and compiling the code, you can access it from the New menu in NinjaTrader’s Control Center. Look for the menu item labeled "Account Balances."
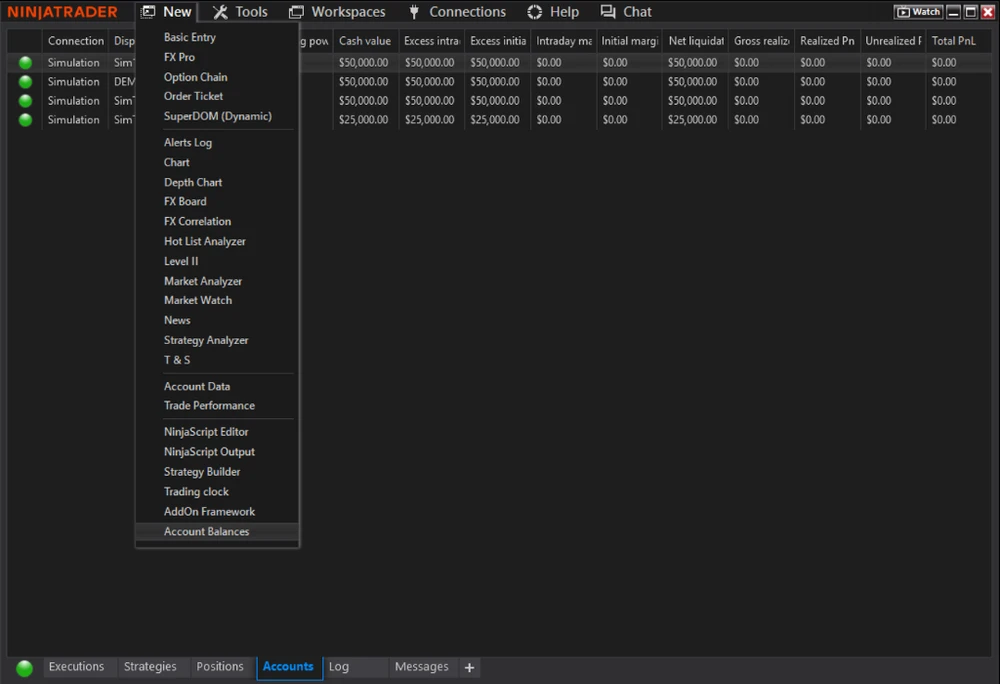
Clicking this item will open a new window with the charts.
Interactive Features
- Hover Effects on Pie Chart: When you hover over any slice of the pie chart, it expands slightly to emphasize the selected data. This hover animation makes it easy to identify individual account balances visually.
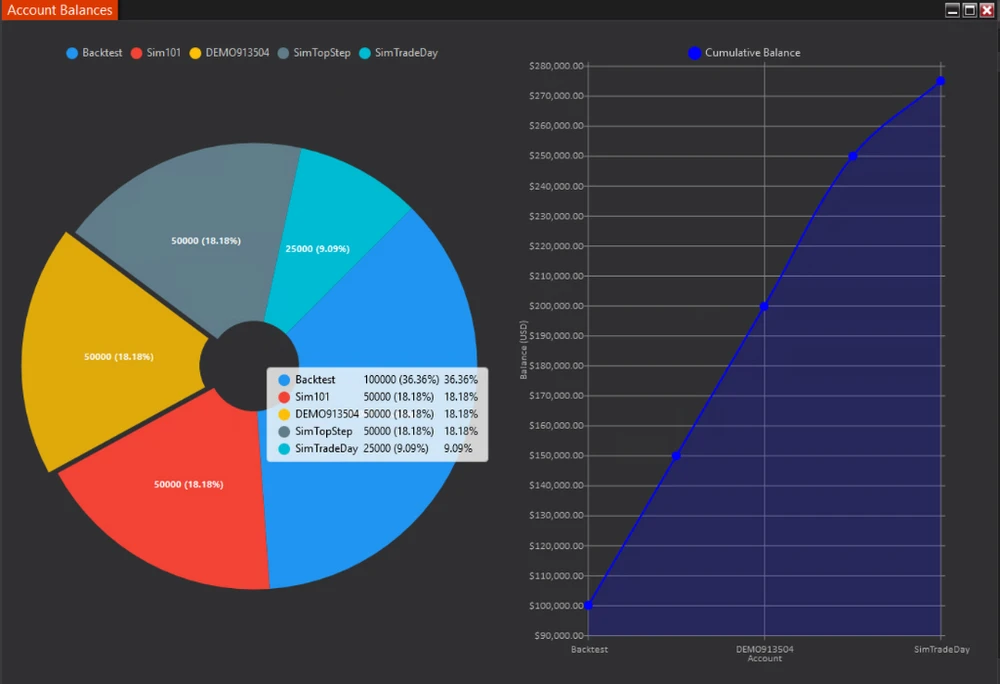
- Interactive Tooltips: Both the pie chart and the line chart include interactive tooltips. On the pie chart, hovering over a slice highlights it, showing detailed information like the account name, balance, and percentage. On the line chart, hovering over any data point reveals a tooltip displaying the cumulative account balance at that specific data point. These features ensure users can quickly gain insights without cluttering the visual space.
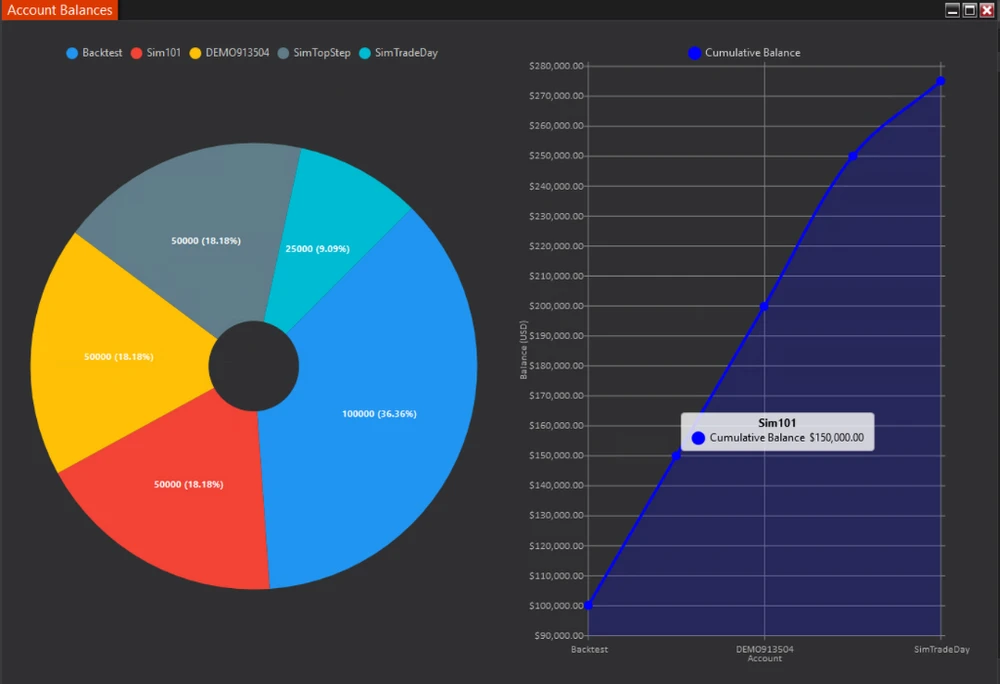
Exploring the Visuals
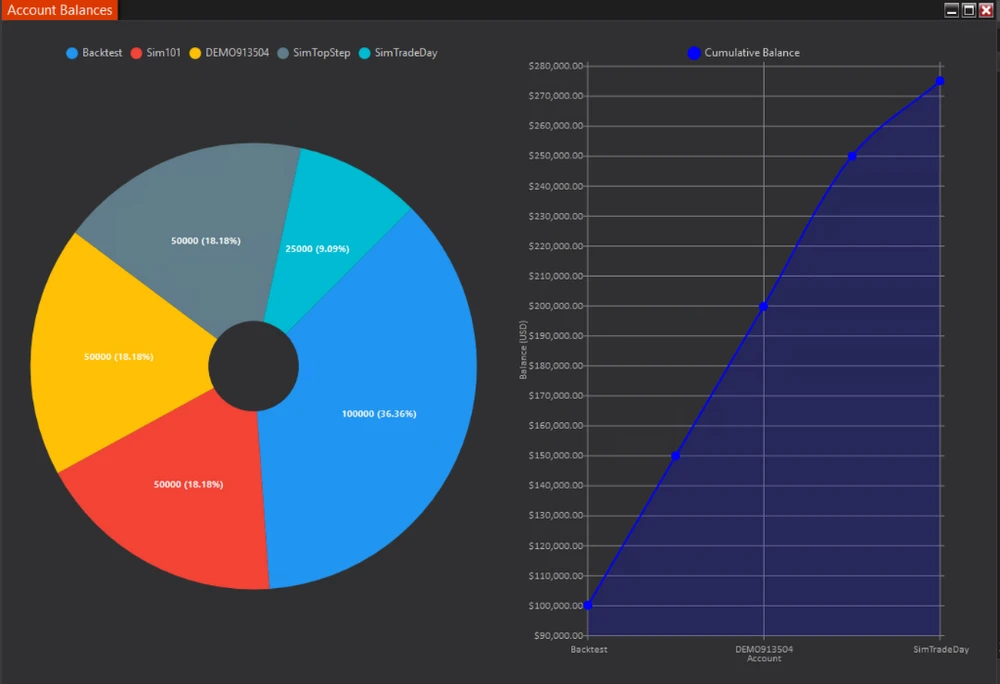
The pie chart and line chart complement each other:
- The pie chart gives a snapshot of how account balances compare as percentages.
- The line chart illustrates the cumulative balance trend, showing how individual accounts contribute to the total.
By combining these two visualizations, users gain a comprehensive view of their account data in an engaging, interactive format. The intuitive interface makes the add-on both informative and visually appealing.
Conclusion
This guide demonstrated how to create a NinjaTrader 8 add-on using the external library LiveCharts to effectively visualize custom data. By breaking the code into smaller, understandable parts, we explored the structure and logic behind the add-on in detail. This example highlights not only the functionality of LiveCharts but also the remarkable flexibility of NinjaTrader as a platform, allowing seamless integration of third-party libraries.
NinjaTrader’s extensibility enables developers to incorporate various tools and integrations, whether for data visualization, algorithmic trading, or third-party APIs. The ability to adapt and extend the terminal ensures it meets diverse needs, making it a powerful choice for traders and developers alike. Expand on this foundation to create even more tailored and advanced solutions within NinjaTrader.
Additional Resources
- LiveCharts Documentation: Explore the LiveCharts website to discover additional charting options and customization features.
- Full Code Example: Access the complete source code for this example here.
- Download the Account Balances Indicator: Access the custom indicator built as part of this article.
