
Introduction
Predicting market trends is one of the most sought-after skills in trading. In this post, we’ll demonstrate how to create a NinjaTrader 8 indicator that predicts price trends using historical data and machine learning with ML.NET. By the end of this guide, you’ll have a custom indicator that visualizes predicted price levels directly on your charts.
What We Will Build
We’ll create an indicator named MLTrendPrediction. It uses historical price data and technical indicators (e.g., ATR, EMA) to train a machine learning model. The model predicts future price movements, and the indicator displays these predictions as visual elements on the NinjaTrader chart.
Prerequisites
- NinjaTrader 8.1.40 installed.
- Visual Studio 2022 installed.
- Download the required libraries directly through the NuGet Package Manager in Visual Studio. Search for and install the following packages with the specified versions:
- Microsoft.ML.dll v3.0.0.0
- Microsoft.ML.Core.dll v3.0.0.0
- Microsoft.ML.Data.dll v3.0.0.0
- Microsoft.ML.DataView.dll v3.0.0.0
- Microsoft.ML.FastTree.dll v3.0.0.0
- netstandard.dll v4.7.3
- Ensure their versions match the specified ones for compatibility.
- Add the following NuGet packages to your NinjaTrader project, then move the downloaded libraries to the folder ...\Documents\NinjaTrader
8\bin\Custom.
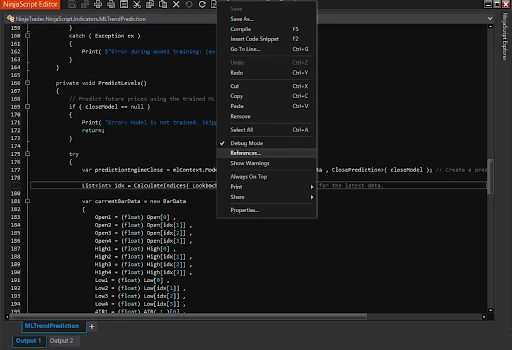
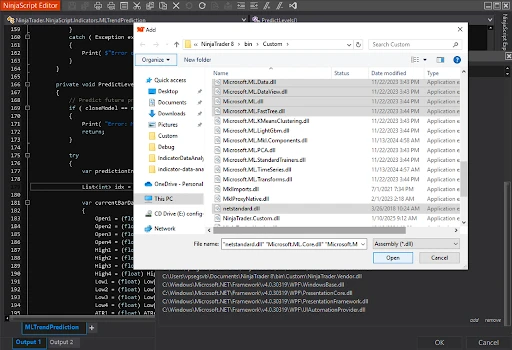
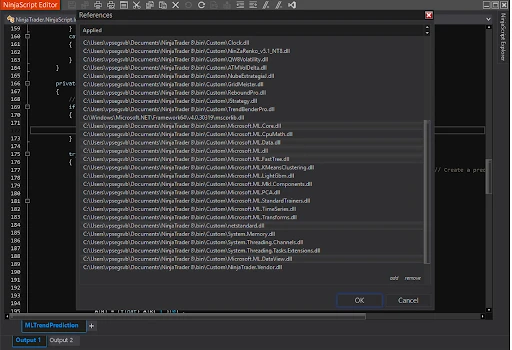
After that, add references to these libraries in your project via NinjaScript Editor:
Programming Plan
Before diving into implementation, it’s essential to outline the key steps for creating the indicator. Here’s the plan:
- Choose Machine Learning Model: We will use the FastTree regression algorithm due to its ability to handle financial time series with high accuracy. This model supports gradient boosting, which is effective for predicting continuous values like future prices. A detailed explanation will follow in Step 2.
- Create Necessary Data Structures: Since our model requires structured input for training and output for predictions, we need to define two classes:
BarDatato store historical market data and calculated features.ClosePredictionto store the predicted future close price. This ensures a clear separation between input features and model output.
- Set Up the ML.NET Pipeline: Configure a pipeline that includes feature extraction, label definition, and a FastTree regression trainer. This pipeline processes the data and trains a regression model to predict future prices.
- Integrate Model Training into NinjaScript: Implement the training logic to periodically retrain the model using historical data. This step ensures the model stays updated with the latest market conditions.
- Visualize Predictions on the Chart: Use NinjaTrader's drawing tools (e.g.,
Draw.ArrowLine)to overlay predicted price levels and trends directly on the chart for easy interpretation.
With this plan in place, we can move to the next steps of building and integrating the indicator.
Step 1: Creating the Indicator and Preparing Data
The first step is to set up the custom NinjaScript indicator and prepare historical data for the machine learning model. Here’s how to get started:
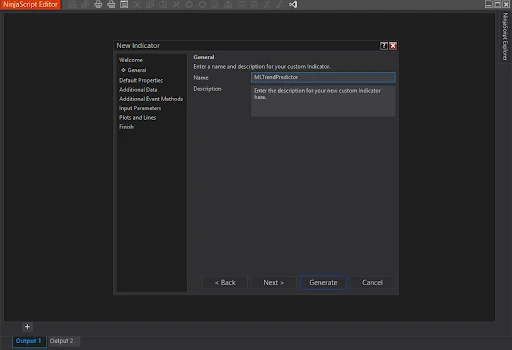
Creating a New Indicator in NinjaScript Editor
- Open NinjaTrader and go to
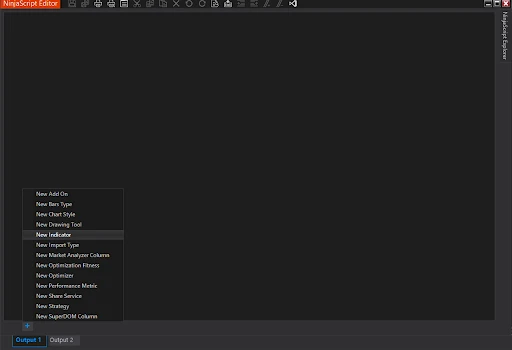
Tools > NinjaScript Editor. - In the NinjaScript Editor, select
New Indicator. - Name your indicator (e.g.,
MLTrendPrediction) and clickGenerate. - The editor generates a template into which we will incorporate machine learning logic.
Data Structures
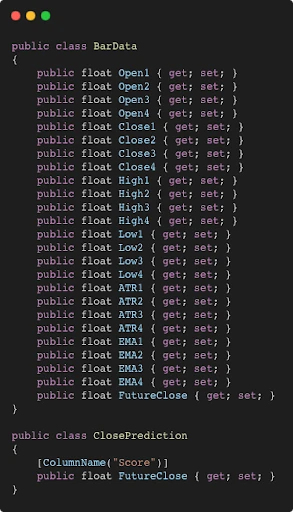
The BarData class is designed to store historical features required for training the model. Since we want to predict the future close price, we include four historical points of OHLC prices, ATR, and EMA values as features. This structured data will help the model learn from patterns in the past to predict future values. A more detailed explanation of data preparation will follow when we discuss accumulating historical data.
The ClosePrediction class captures the output of the machine learning model, which is the predicted future close price. The [ColumnName("Score")] attribute specifies that the output column from the model's prediction corresponds to the property FutureClose. This attribute is required to correctly map the model's prediction output to the property, ensuring compatibility between the trained pipeline and the prediction engine.
Preparing Historical Data
Preparing data for supervised learning is a critical step in building a predictive model. This section will walk through the logic and key parameters used to collect and structure data for our machine learning model.
Key Parameters Explained:
- Training Period: Specifies the number of historical bars used to train the model. A sufficiently large value (e.g., at least 100) ensures that the model has enough data to identify patterns and make accurate predictions. Setting this too low might lead to poor generalization due to insufficient data.
- Lookback Period: Defines the total range of historical bars to analyze. This period is divided into four equally spaced points.
- OHLC Data: Open, High, Low, and Close prices, representing key market information.
- ATR (Average True Range): This is used to calculate the size of the bar's range. Since we use a period of 1, the ATR essentially becomes the difference between the High and Low prices for each bar. This provides a straightforward measure of bar size without additional smoothing or averaging.
- EMA (Exponential Moving Average): A smoothed price average giving more weight to recent data.
- FutureClose: The target variable we want to predict, representing the future closing price. Including this as the target helps guide the model during training, allowing it to focus on identifying patterns in historical data that influence future price movements. This makes it crucial for the supervised learning process, as the model orients itself based on how these patterns align with the predicted price.
Data Collection Logic:
- We use the Lookback Period to define the range of historical data that the model will use for training. This range is divided into four evenly spaced points using a helper function. Below is the function
CalculateIndices, which performs this calculation:
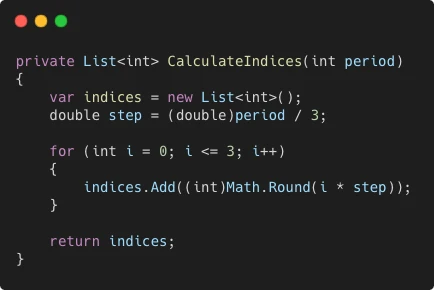
Each point represents a specific interval within the lookback period. The CalculateIndices function works by dividing the total lookback period into four evenly spaced intervals. This is achieved by calculating a step size (period/3) that ensures the indices are evenly distributed. For each of the four points, the function rounds the calculated position to the nearest integer to get precise indices.
For example, if the lookback period is 12 bars, the step size is 4. The resulting indices would be 0, 4, 8, and 12, representing the start, quarter, midpoint, and end of the lookback period. These indices help extract OHLC, ATR, and EMA values at key moments, providing the model with a balanced view of the market's historical trends.
2. Store this data in the BarData structure to prepare it for model training.
To implement this, we define the PrepareData function. This function loops through historical bars, gathers features for each interval, and compiles a dataset for supervised learning:
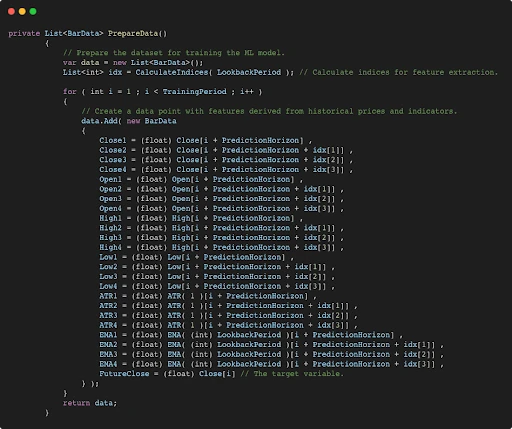
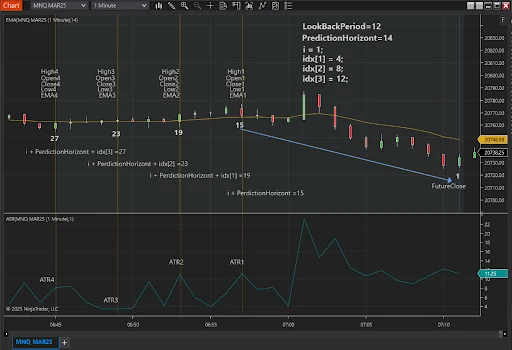
The next image visually represents the first iteration of the training process. It demonstrates how the prepared data from the PrepareData step is mapped to the target value (FutureClose). This iteration is a key example of how the model learns from historical patterns.
For this example, the parameters are set as follows: LookBackPeriod = 12, which defines the range of bars analyzed for feature extraction, and PredictionHorizon = 14, indicating the number of bars ahead for the predicted target value. The process shown in the image repeats for subsequent iterations (e.g., i = 2, i = 3, etc.), allowing the model to gradually improve its ability to predict future price movements by processing the entire TrainingPeriod.
Step 2: Building the Machine Learning Model
Understanding the Machine Learning Model
Our indicator uses the FastTree regression algorithm provided by ML.NET. This algorithm is efficient for handling numerical data and supports features like gradient boosting. Here's why we chose FastTree.
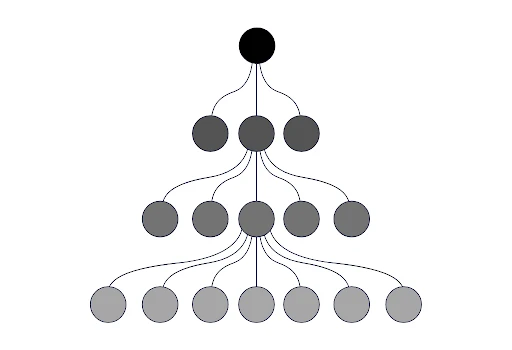
The FastTree regression algorithm is a type of machine learning model that helps predict numbers, like the future price. Think of it like a decision-making tree, where each branch splits into smaller branches, eventually leading to a result.
What is Gradient Boosting?
Gradient boosting is like a teacher helping the tree improve step by step. Imagine the tree makes a guess, and if it’s wrong, the teacher tells it how to fix the mistake. The tree tries again, getting closer to the correct answer each time. By repeating this process, the tree becomes very good at making accurate predictions.
Why Did We Choose FastTree?
- Accuracy: It learns from past data and becomes better at predicting trends.
- Efficiency: It doesn’t need as much data as some other models to work well.
- Flexibility: You can adjust how fast it learns (learning rate) and how complex the tree can be (number of leaves).
Model Training Process
The training process involves several key components that ensure the FastTree regression model can learn effectively from the provided data. Here's a breakdown of each part:
- Input Features: These include
Close1, Close2, Close3, Close4, Open1, Open2, Open3, Open4, High1, High2, High3, High4, Low1, Low2, Low3, Low4, ATR1, ATR2, ATR3, ATR4, EMA1, EMA2, EMA3,andEMA4. Each of these features is extracted from four points in the lookback period, providing a comprehensive snapshot of historical market conditions. This ensures the model captures patterns over time, enhancing its ability to predict future price movements. - Label Definition: The
FutureCloseserves as the label, representing the target value the model aims to predict. This allows the supervised learning algorithm to map patterns from the features to the label. - FastTree Regression Trainer: This algorithm builds decision trees iteratively to minimize the error, leveraging hyperparameters like:
NumberOfLeaves: Controls the complexity of each tree.MinimumExampleCountPerLeaf: Ensures generalization by setting a minimum number of samples per leaf.LearningRate: Adjusts the weight updates during training to balance speed and accuracy.
- MLContext: This object serves as the main entry point for all ML.NET operations. It provides a central hub for managing the machine learning lifecycle, including data processing, training, evaluation, and prediction. In our implementation, the MLContext object is initialized once to ensure a consistent context for all ML.NET operations throughout the lifecycle of the indicator. We place the model creation process in the DataLoaded state because it ensures that all historical data is available before constructing the ML pipeline and training the model. This separation aligns with NinjaTrader's lifecycle events, allowing the model to access the necessary data for accurate feature preparation and training.
- Append Method: Used to chain data transformations and trainers in the pipeline. Each Append call adds a new stage to the pipeline, such as feature concatenation, label assignment, or applying the FastTree trainer. This modular approach makes it easy to configure and customize the model training process.
Here’s the pipeline setup:
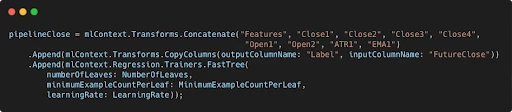
This pipeline transforms the historical data into features and trains the FastTree regression model.
TrainModel Function
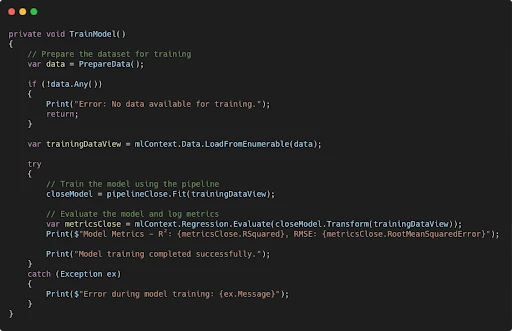
Explanation of TrainModel
- Preparing the Dataset:
- The
PrepareDatafunction gathers historical data, extracting features like OHLC prices, ATR, and EMA values into theBarDatastructure. - If the dataset is empty (
!data.Any()), the function exits and logs an error, ensuring that the model training process only starts with sufficient data.
- The
- Converting Data to ML.NET Format:
- The
mlContext.Data.LoadFromEnumerable(data)method converts the collectedBarDatalist into an ML.NET-friendly format calledIDataView, which is required for model training.
- The
- Model Training:
- The pipeline (
pipelineClose) is used to fit the training data and produce a trained model (closeModel).
- The pipeline (
- Model Evaluation:
- The
Evaluatemethod measures the performance of the trained model on the same dataset. Metrics like R² (how well the model explains the variance) and RMSE (error magnitude) are logged to assess accuracy.
- The
- Error Handling:
- Any exceptions encountered during data loading, model training, or evaluation are caught and logged. This ensures stability and makes debugging straightforward.
By retraining the model periodically, the indicator adapts to new market conditions, ensuring that predictions remain relevant and accurate.
Step 3: Integrating Predictions into NinjaTrader
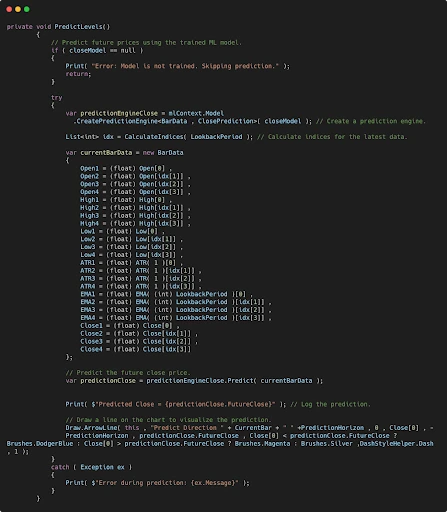
The trained model is used to predict future price levels during the OnBarUpdate event. Here’s a detailed breakdown of how predictions are made and visualized:
- Checking Model Availability: The function first verifies whether the closeModel is trained. If the model is null, the function exits, ensuring no predictions are attempted without a valid model.
- Prediction Engine: A prediction engine is created using the
mlContext.Model.CreatePredictionEnginemethod. This method takes two arguments: - Input Class (
BarData): This class defines the structure of the input data used for predictions. It includes features such as OHLC prices, ATR, and EMA values extracted from the chart. - Output Class (
ClosePrediction): This class specifies the format of the model's output, which in this case is the predictedFutureClosevalue.
By passing these two classes toCreatePredictionEngine, the method ensures that the model's inputs and outputs are correctly mapped to the respective properties, enabling seamless predictions on new data. - Preparing Input Data: The
BarDataobject is populated with current OHLC, ATR, and EMA values from the last four calculated points. TheCalculateIndicesfunction helps determine these points based on the lookback period. - Making Predictions: The prediction engine uses the
Predictmethod to forecast the future close price (FutureClose) based on the preparedBarData. - Visualization: The function draws an arrow line on the chart to indicate the predicted trend and the predicted future price. The arrow originates from the current price and points to the predicted future price, visually representing the forecasted movement. This provides a clear, intuitive way to observe the model's output directly on the chart. To learn more about the ArrowLine method, refer to NinjaTrader's documentation.
Using Functions in the OnBarUpdate Method
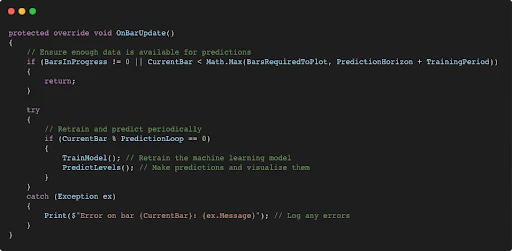
Explanation of OnBarUpdate
- Data Availability Check:
BarsInProgress != 0: Ensures that the method executes only for the primary data series.CurrentBar < Math.Max(BarsRequiredToPlot, PredictionHorizon + TrainingPeriod): Prevents execution until sufficient data (enough bars) is available for both training and predictions.
- Periodic Execution:
CurrentBar % PredictionLoop == 0:Ensures that the model is retrained and predictions are made periodically, as defined by thePredictionLoopparameter. This helps maintain a balance between model updates and performance.
- TrainModel Method:
- Retrains the machine learning model using the latest historical data. This step ensures the model stays updated with current market conditions and trends.
- PredictLevels Method:
- Uses the trained model to predict future price levels and visualizes these predictions directly on the chart. This step provides traders with actionable insights based on machine learning outputs.
- Error Handling:
- Catches any exceptions thrown during model training or prediction and logs an error message. This ensures the stability of the script and simplifies debugging.
For more details about how the OnBarUpdate method works, you can refer to NinjaTrader's documentation.
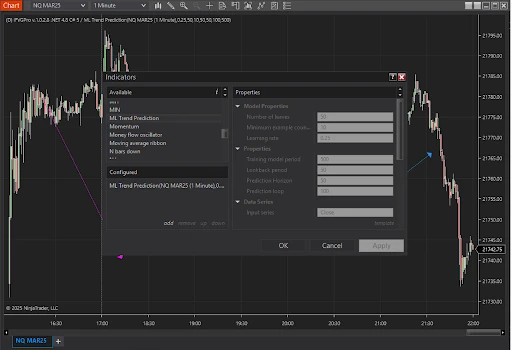
Running the Indicator and Viewing Predictions
Once you have integrated the PredictLevels method and linked it with the OnBarUpdate event, you can launch your indicator on the NinjaTrader chart. Here’s how to do it:
Apply the Indicator:
- Open a chart in NinjaTrader.
- Click Indicators, and choose
MLTrendPredictionfrom the list.
Set Indicator Parameters:
After selecting the indicator, configure its parameters in the properties panel:
- TrainingPeriod: Set the number of historical bars for model training (minimum 100 recommended).
- LookbackPeriod: Define the range of bars to analyze for generating features.
- PredictionHorizon: Specify the number of bars ahead to predict.
- PredictionLoop: Adjust how often the model retrains and makes predictions (e.g., every 50-100 bars).
Note: SettingPredictionLooptoo small (e.g., 10 or 20 bars) can significantly increase computational load and slow down performance. Use a larger value to balance accuracy and resource usage. - Model Hyperparameters (optional): Modify values such as
NumberOfLeaves, LearningRate,MinimumExampleCountPerLeaffor optimization.
Enable Data:
- Ensure your chart has enough historical data loaded for training and prediction to work effectively. More bars should be rolled on the chart than set in
TrainingPeriod.
Visualization:
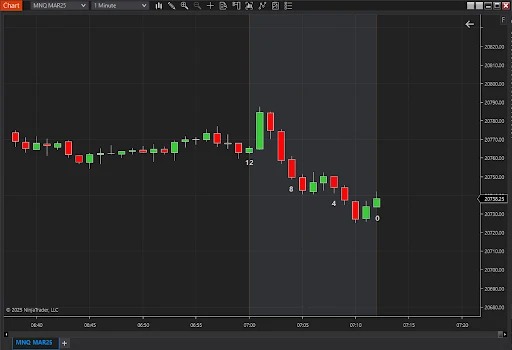
- Once applied, the indicator will begin predicting price trends.
- Look for arrows on the chart, indicating predicted future prices and trends based on your model.
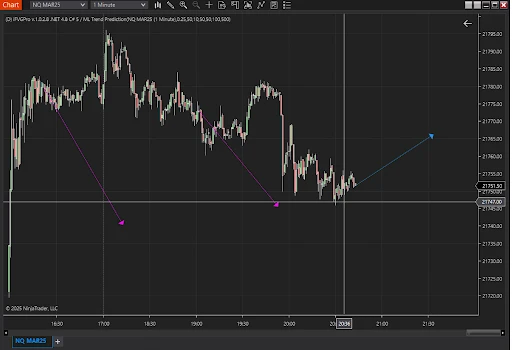
The first image showcases the MLTrendPrediction indicator in action, predicting a future price trend with an arrow. In the second image, the market confirms the prediction by moving in the indicated direction.
This combination highlights the effectiveness of integrating machine learning into technical analysis.
Conclusion
By integrating ML.NET into NinjaTrader, we built an advanced price trend prediction indicator. This approach combines historical data, technical indicators, and machine learning to enhance trading decisions.
Resources
- ML.NET Documentation
- NinjaTrader Scripting Guide
- MLTrendPrediction Indicator Export
- Visual Studio Project Template
Thank you for following this tutorial. Good luck with your trading and coding journey!
