
What is Downside Deviation?
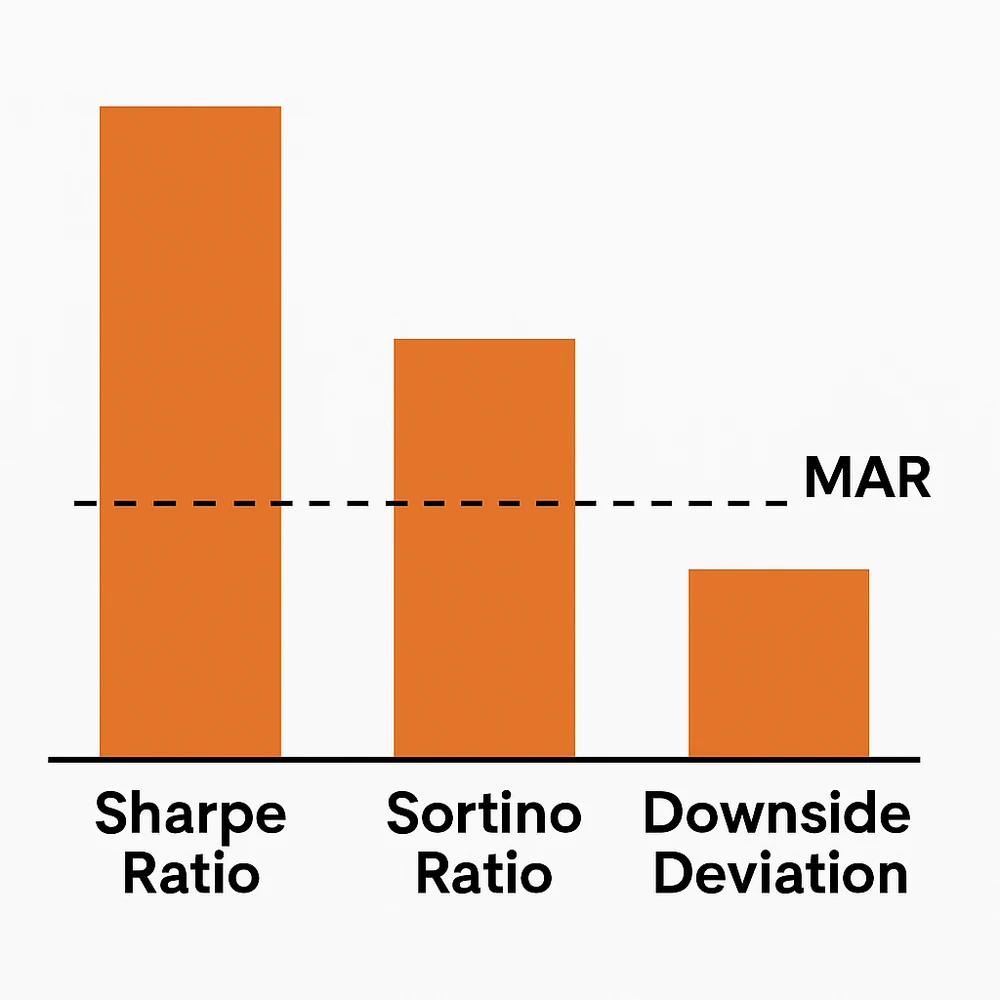
When traders talk about performance, they often default to Sharpe or Sortino ratios — but both still consider some level of upside volatility as “risk.”
That’s where Downside Deviation stands out.
Downside Deviation only focuses on bad outcomes — it measures how much your returns fall below a threshold you care about, known as the Minimum Acceptable Return (MAR).
If you're okay with a 5% return, the metric doesn’t punish anything above that. It’s all about how often — and how far — your trades fall short.
Focusing on Loss Risk
Many traders test strategies in batches. Some strategies make good returns on average, but dip painfully below your expectations along the way.
Downside Deviation lets you quantify that discomfort.
Instead of treating all volatility equally, you get a tailored risk view — one that highlights only the returns that miss your defined goal. This makes it especially useful when evaluating strategies with tight drawdown limits or capital protection goals.
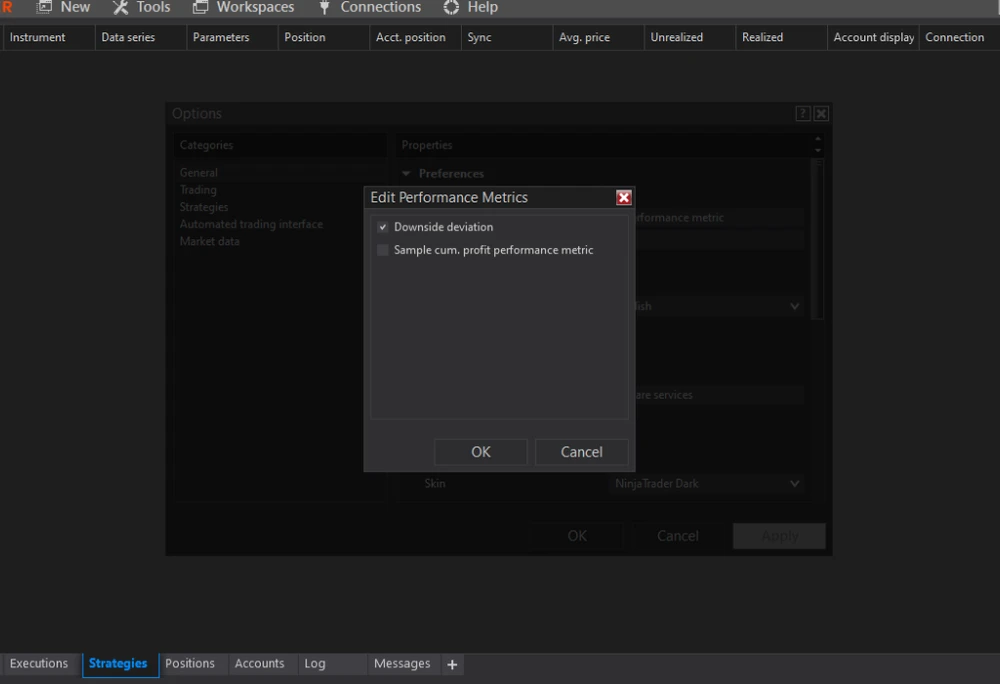
How it Works in NinjaTrader 8
This custom performance metric plugs directly into Strategy Analyzer in NinjaTrader 8.
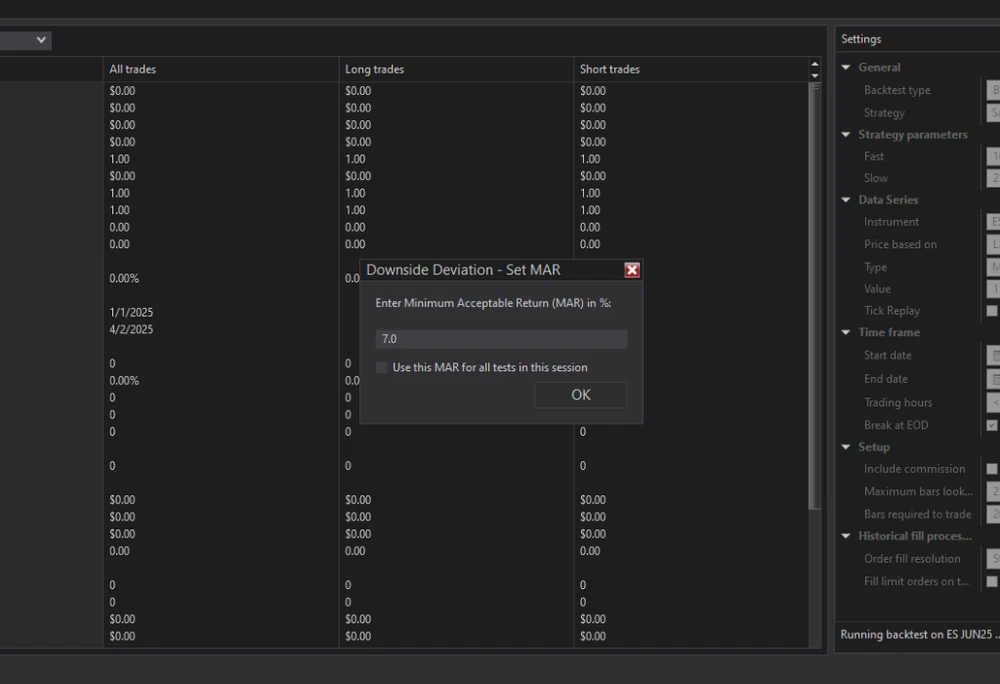
Before the backtest runs, a small pop-up window prompts you to input your MAR — say, 7% — and the system automatically computes the deviation using only the trades that fell short.
You don’t need to dig through trade logs or manually screen out poor outcomes — it’s handled in real-time, per strategy, or across all instruments.
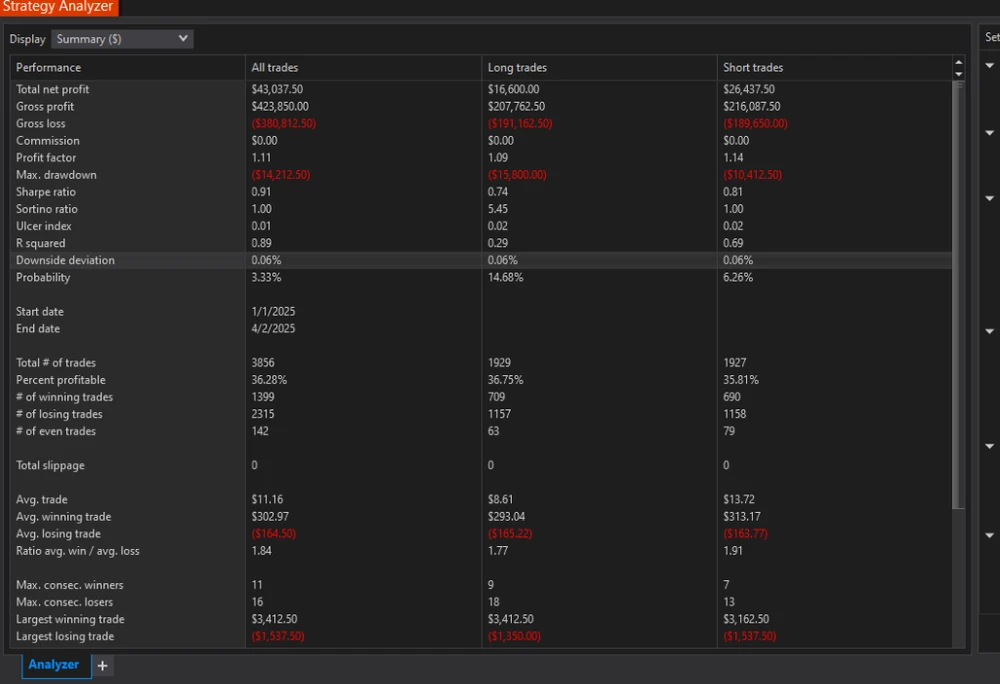
After your test finishes, the Downside Deviation metric appears alongside familiar stats like Net Profit, Drawdown, and Sharpe Ratio.
You’ll see a concise number that tells you exactly how volatile your strategy is when it fails to meet your baseline.
For multi-instrument tests, the metric aggregates correctly using custom merge logic — skipping false readings from internal NinjaTrader merges.
When to Use it
If your goal is capital preservation rather than chasing big wins, this is the metric for you.
Whether you're building swing strategies, scalpers, or market-neutral models, Downside Deviation helps you answer the question:
“How bad does it get when my strategy underperforms?”
And that answer could be the key to deciding whether it’s time to go live — or keep refining your model.
Conclusion
Downside Deviation is a simple but powerful tool for measuring real risk in trading strategies.
It doesn’t get distracted by volatility for volatility’s sake — it focuses on what actually matters to traders: the trades that miss expectations.
If you're serious about building systems you can rely on, this metric deserves a spot in your toolkit.
