
Why is Debugging Important?
Debugging is a core skill for any developer working with trading algorithms or custom indicators. A well-structured debugging process helps you:
- Understand how your code behaves.
- Isolate issues effectively.
- Ensure that your NinjaScript logic is reliable under real-world conditions.
In this guide, we’ll walk through debugging scripts in NinjaTrader 8 using a Simple Moving Average (SMA) indicator as an example.
What We’ll Cover in This Post
By the end of this post, you will be able to:
- Build a custom indicator (14-period Simple Moving Average).
- Recognize and avoid common coding errors.
- Use
Print(),Log(),Output.Process(), andtry-catchfor debugging. - Write debug information to files.
- Attach Visual Studio and work with breakpoints.
- Apply pro tips with a ready-to-use debugging checklist.
What You’ll Need to Follow Along
Before starting, make sure you have:
- NinjaTrader 8 (latest version 8.1.5.2)
- Visual Studio Community Edition – free and perfect for NinjaScript debugging
- (Optional) NinjaTrader Desktop Developer Guide – for quick method lookups
Step 1: Prepare Your Environment for Debugging
To set up the connection between NinjaTrader and Visual Studio :
1. Enable Debug Mode in NinjaScript Editor:
From the NinjaTrader Control Center, click New > NinjaScript Editor.
Right-click inside the NinjaScript Editor and select Debug mode. This ensures breakpoints are active once Visual Studio is attached.
2. Open the Solution in Visual Studio:
Click the Visual Studio (VS) icon in the NinjaScript Editor toolbar. (If VS is not installed, download and install it first.)
3. Save the Project as a Solution in Visual Studio:
In Visual Studio, go to File > Save As and save your project as a .sln solution file. This is required to attach VS to the NinjaTrader process.
4. Compile and Fix Syntax Errors:
At this stage, compiling is not strictly required, but before every debugging session, you should ensure that:
- The code is compiled without errors.
- All syntax issues are resolved.
Use Compile (F5) in the NinjaScript Editor to verify that your project is ready for debugging.
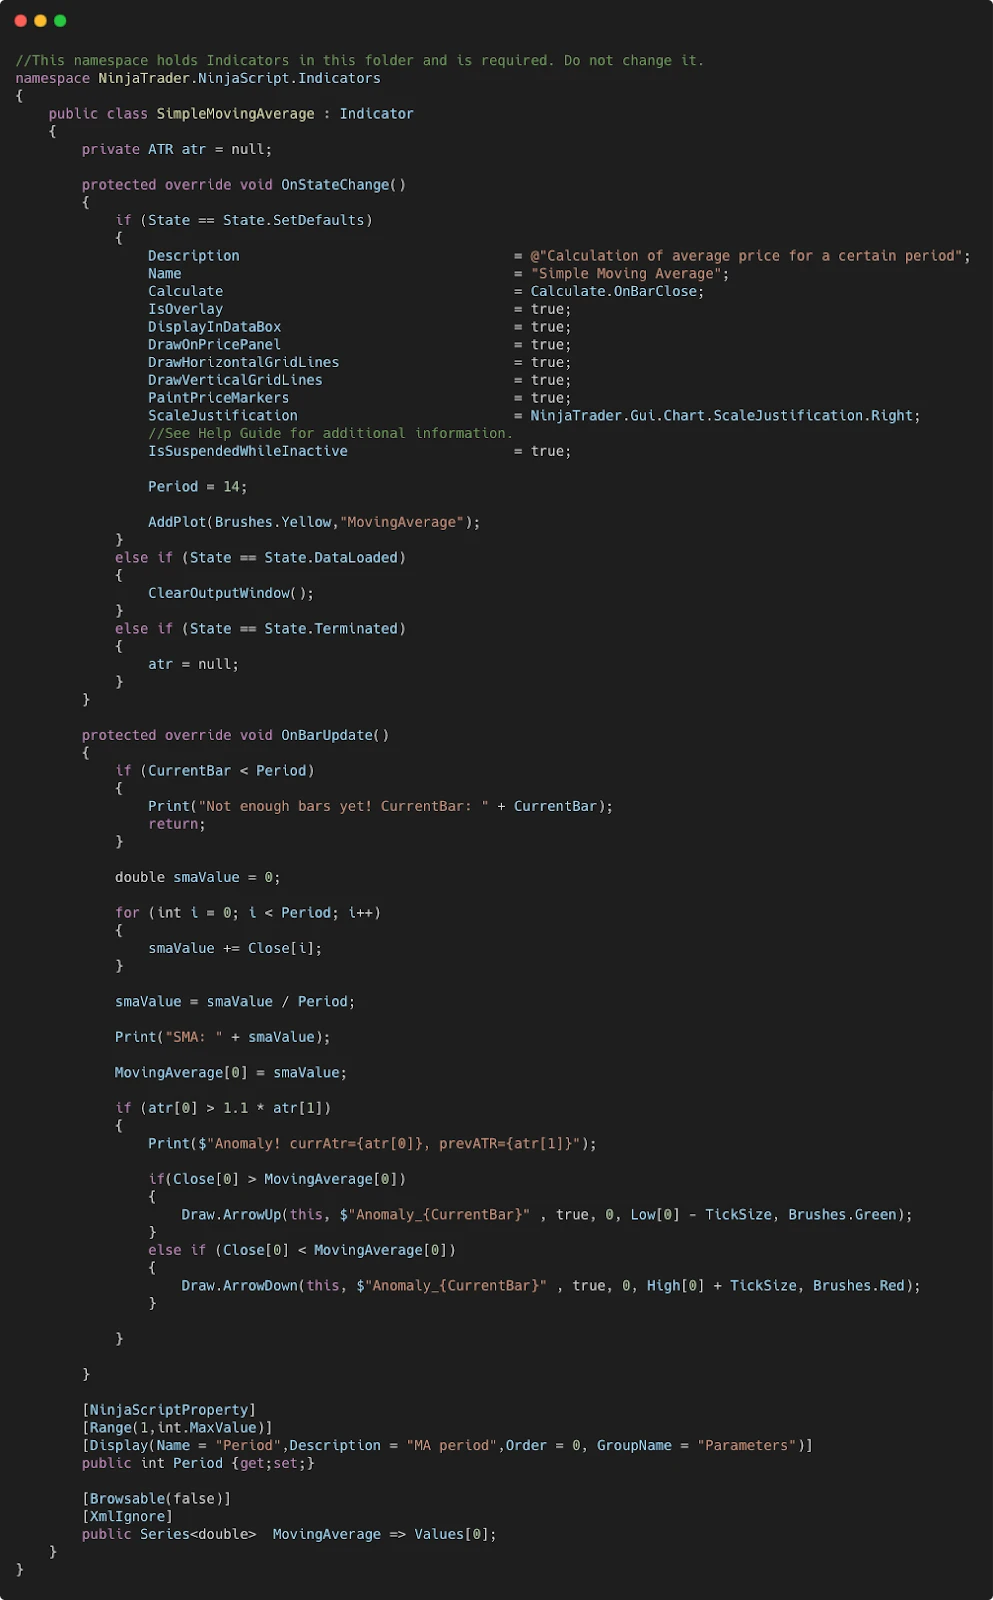
Step 2: Build a Simple Moving Average Indicator
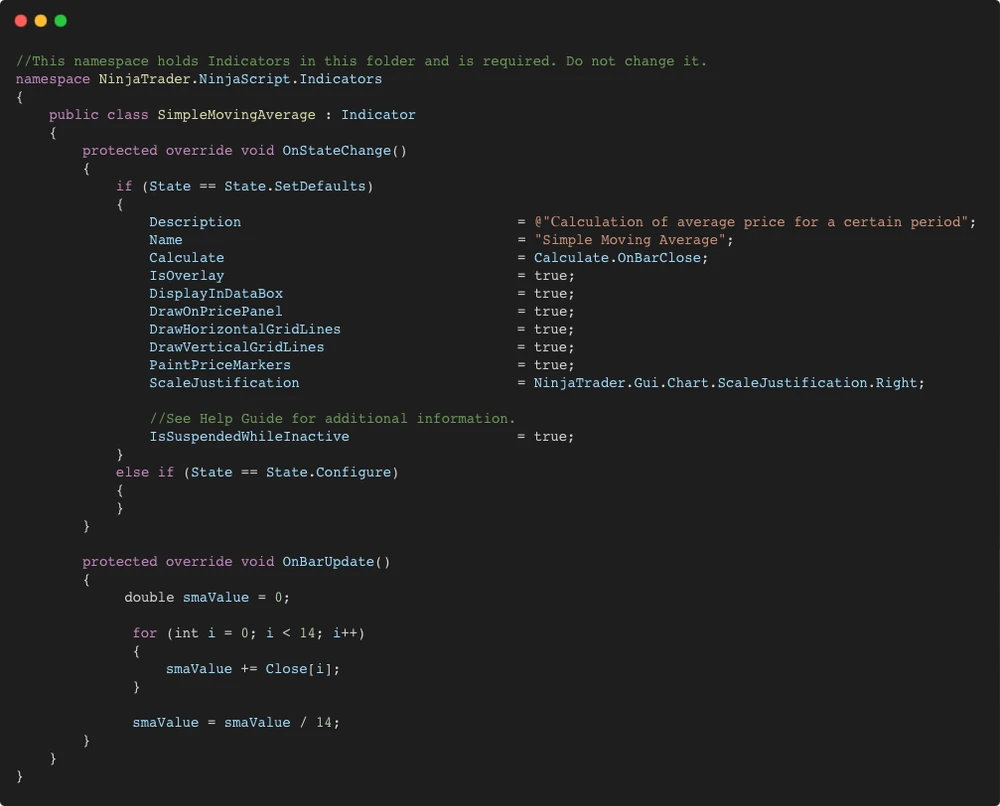
We’ll begin with a basic SMA calculation by creating an initial stub — a class automatically generated by NinjaTrader’s indicator constructor, where we only define a name and a short description.
Once this skeleton is ready, we’ll jump straight into developing the core logic. By implementing this first version, we’ll quickly identify the initial errors and common pitfalls we might encounter during the development process.
Let’s run this script on a chart and observe the result.
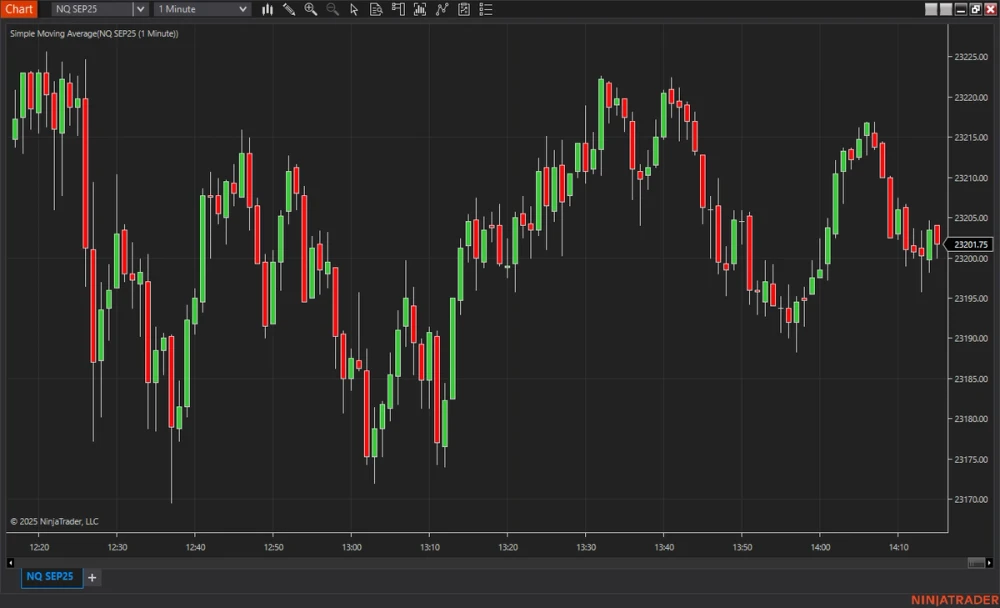
As you can see, nothing is displayed on the chart yet.
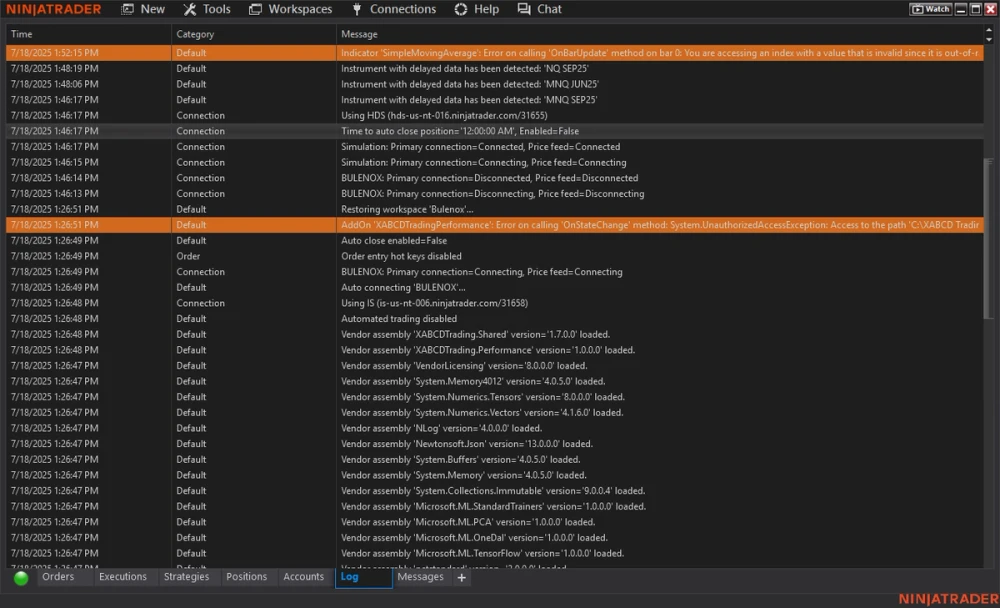
However, if we check the Logs tab, we can see what messages the system is providing.
Step 3: Use Print() to Trace and Diagnose the Error
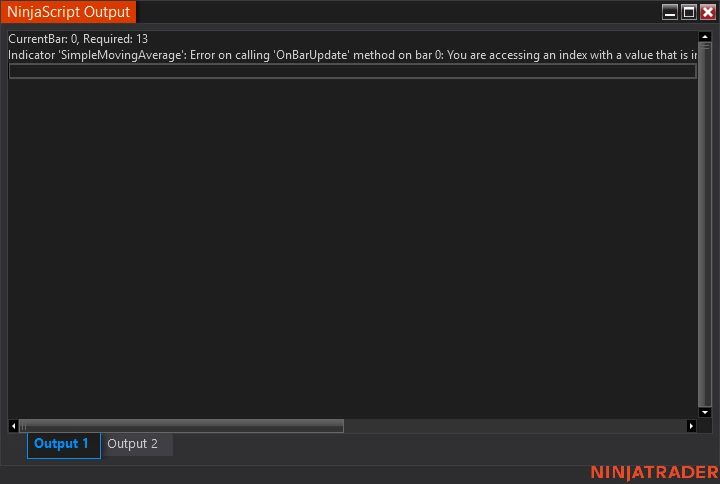
After running the script, we can see the following error message in the logs:
Time Category Message
7/18/2025 1:52:15 PM Default Indicator 'SimpleMovingAverage': Error on calling 'OnBarUpdate' method on bar 0: You are accessing an index with a value that is invalid since it is out-of-range. I.E. accessing a series [barsAgo] with a value of 5 when there are only 4 bars on the chart.
It is evident that this is an index-out-of-range error.
Let’s add our first debugging tool to understand why this happens.
Using Print() for Diagnosis
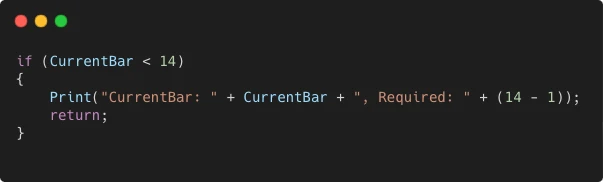
To monitor what’s happening, insert a Print() statement before the main SMA calculation logic.
This will display both the current bar index and the required number of bars needed to calculate the SMA:
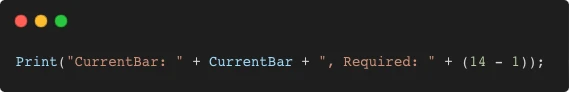
This simple line will tell you:
- Which bar is currently being processed.
- How many bars are required before the SMA can be computed safely.
This information helps pinpoint when and why the error occurs.
Clearly visible in the NinjaScript Output window, the Print() statement shows the current bar index and the required number of bars:
CurrentBar: 0, Required: 13
What does this conclusion tell us? What is the solution?
The output indicates that we are trying to access bars that have not yet been loaded.
To avoid this error, we need to add a check for the required number of bars before performing any calculations.
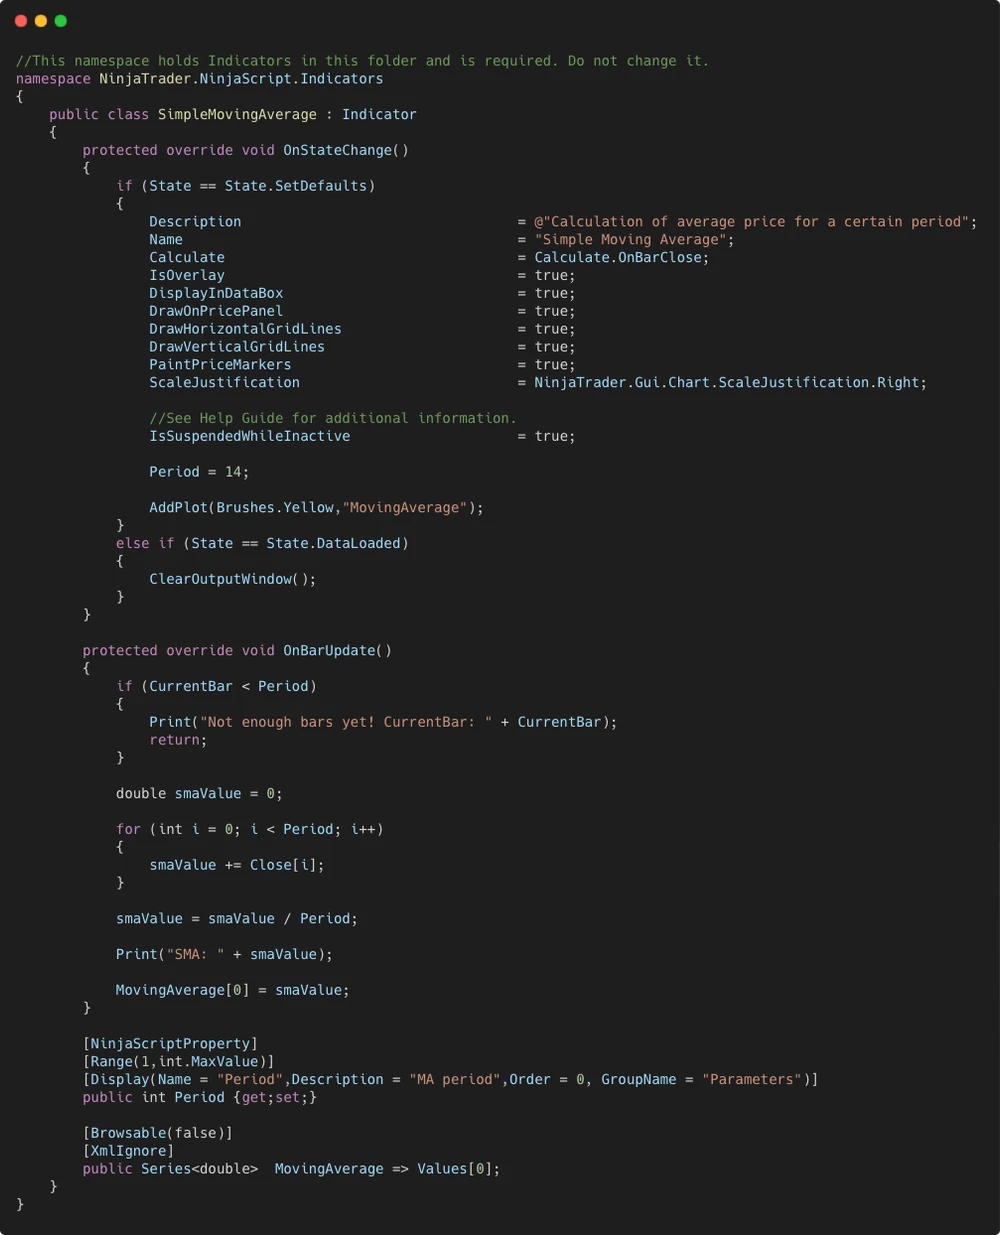
However, since we plan to allow the user to select the period for calculating the average, we will:
- Add a new parameter for the period.
- Add plots to display the SMA value.
- Add the
ClearOutputWindow()method (which will clear the old information after restarting the indicator). - Slightly modify the condition for checking the available bars.
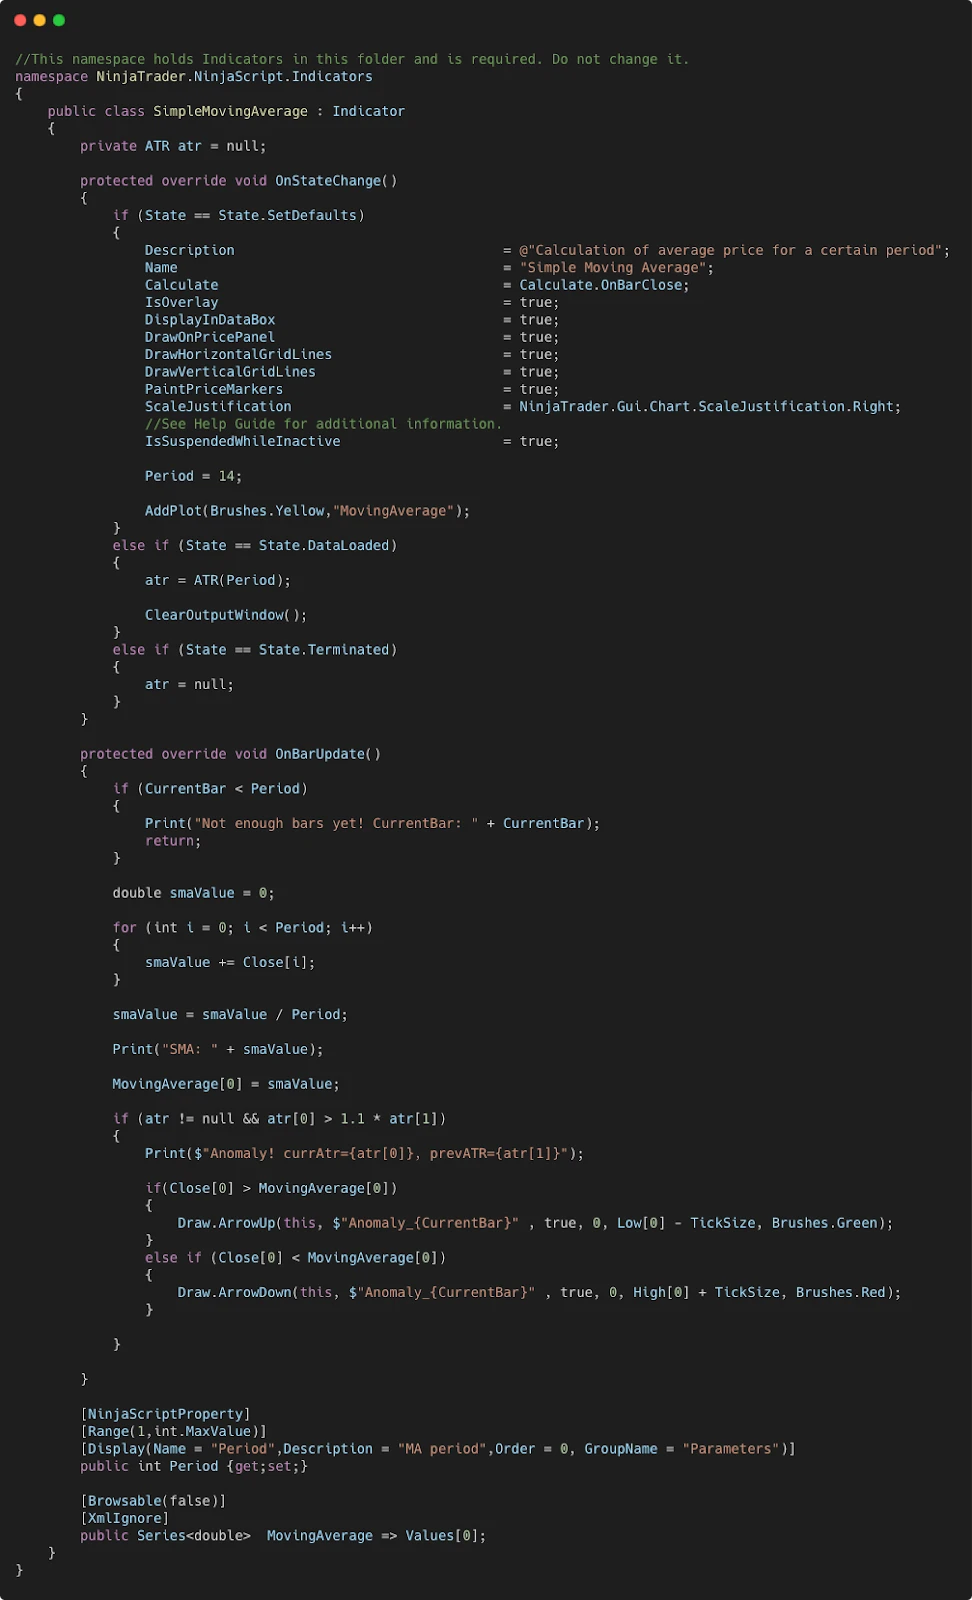
Now our full code looks like this:
Why use a parameter?
It’s important to use the Period parameter (instead of a hardcoded value like 14) in all checks and calculations. This ensures that your code remains accurate, safe, and adaptable, even if the user changes the period to a value greater than 14.
By always referencing the parameter, you:
- Prevent out-of-range errors caused by insufficient bars.
- Make your indicator flexible and responsive to any user-defined input.
Now, when we run the script and even increase the period value from 14 to 20, we will observe the following:
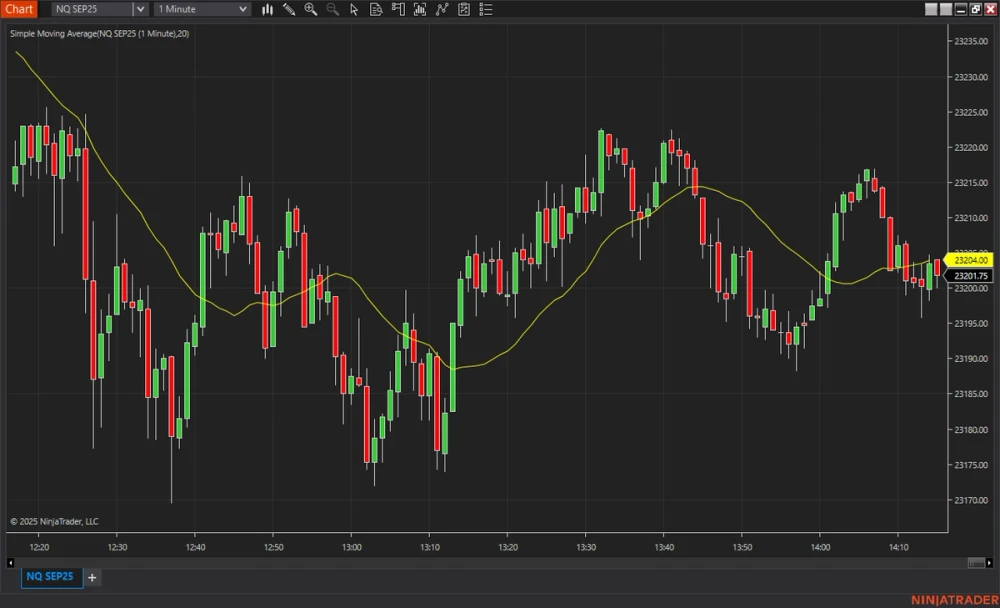
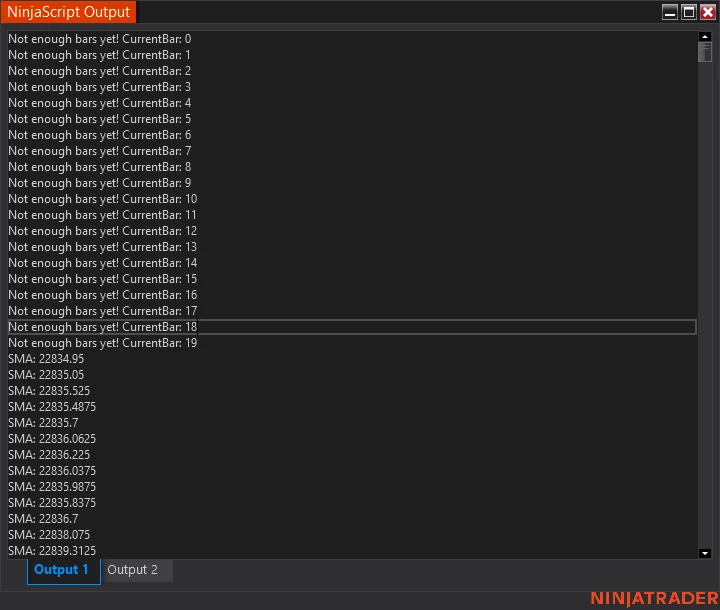
Our moving average is now correctly displayed as a curve on the chart, which is evident.
Additionally, the NinjaScript Output window provides detailed insights into the script’s behavior.
The output confirms that the script correctly skipped the initial 20 bars (as required) before starting the calculation logic.
Once enough bars became available, the code successfully:
- Accessed the full historical data using index-based access.
- Retrieved the closing prices.
- Computed the average value.
This entire process is clearly reflected in the printed output, which shows the calculated average price for each bar.
Pro Tips for Advanced Logging
While Print() is useful for basic debugging, professional developers often combine it with more powerful logging techniques:
1. Using try-catch with Output.Process
This allows you to capture exceptions and send detailed messages to specific Output tabs:
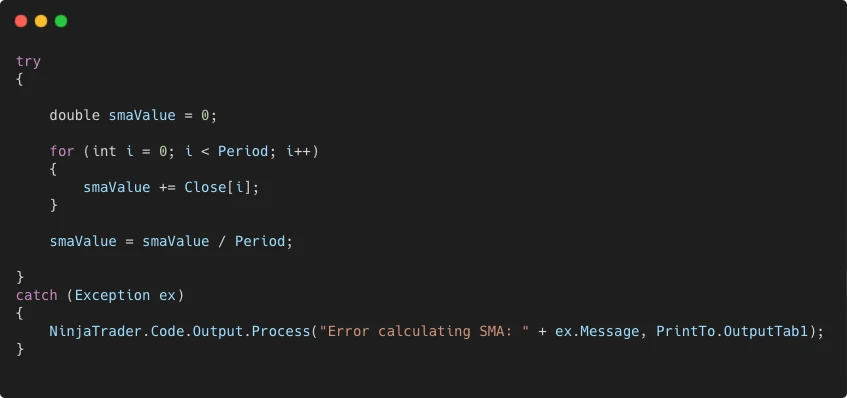
You can also use PrintTo.OutputTab2 if you want to separate logs by categories.
2. Using the Log() Method
Log() writes structured messages to the Log tab in NinjaTrader with a specific log level:
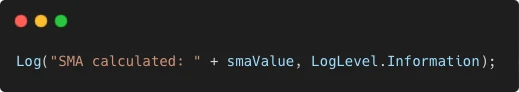
You can also use LogLevel.Error or LogLevel.Warning for other scenarios.
3. Writing to a File
For persistent logging across sessions, you can log messages directly to a file:
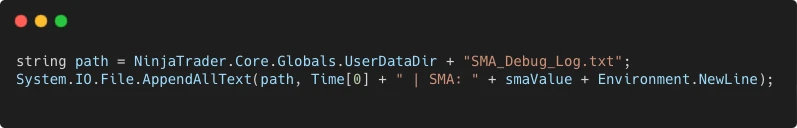
This approach is invaluable when debugging long-running strategies, where reviewing historical logs is necessary.
Step 3 Summary
In this step, we explored the Print() method as a primary tool for tracking the execution flow and detecting issues, such as out-of-range errors. We learned how adding simple debug messages can reveal the exact moment and conditions where the logic fails.
For more advanced debugging, we also looked at:
try-catchblocks withOutput.Process()for capturing and displaying exceptions.Log()for structured messages in the NinjaTrader Log tab.- File logging for persistent data collection across sessions.
These tools together form a solid foundation for understanding how your script behaves, allowing you to detect anomalies and analyze code performance even when you’re not actively monitoring the chart.
Step 4: Add an Additional Indicator for More Complex Logic
In this step, we will enhance our script by introducing an additional indicator.
This will allow us to compute more complex logic by combining multiple data sources or indicators to achieve advanced behavior.
It will also lead to the appearance of new, more frequent errors, which we will need to detect and troubleshoot using additional debugging tools.
Let’s add the ATR (Average True Range) indicator to our code by creating a dedicated variable for it.
Next, we will define a condition that combines the previously calculated moving average and ATR values to highlight specific price events directly on the chart using arrow drawing tools.
Let’s run the indicator and observe the result.
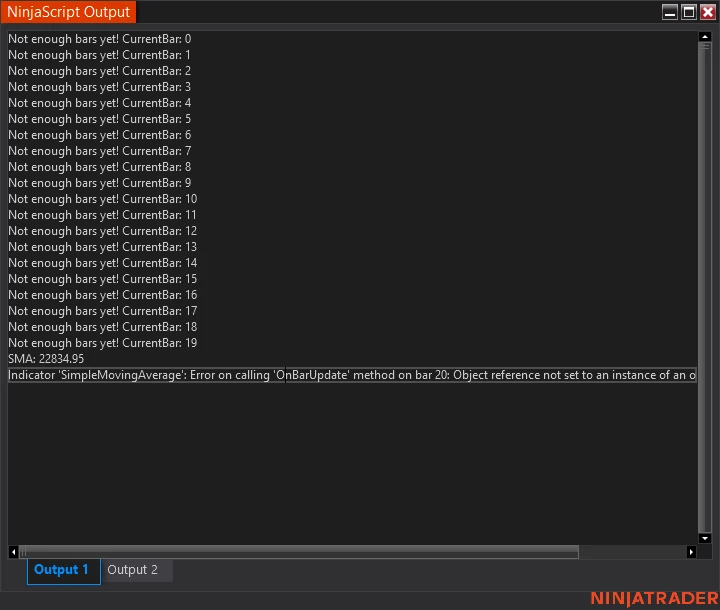
Notice that while the code starts executing and even calculates our moving average, we immediately encounter a null reference error.
Logically, we can deduce that the execution stopped right after the average was calculated. This suggests that the issue lies within our new code with anomaly-checking conditions.
At this stage, we will debug by using breakpoints and stopping on errors in Visual Studio to pinpoint the exact source of the problem.
Step 5: Using Visual Studio and Breakpoints
Debugging the Error
To debug the error using Visual Studio, follow these steps:
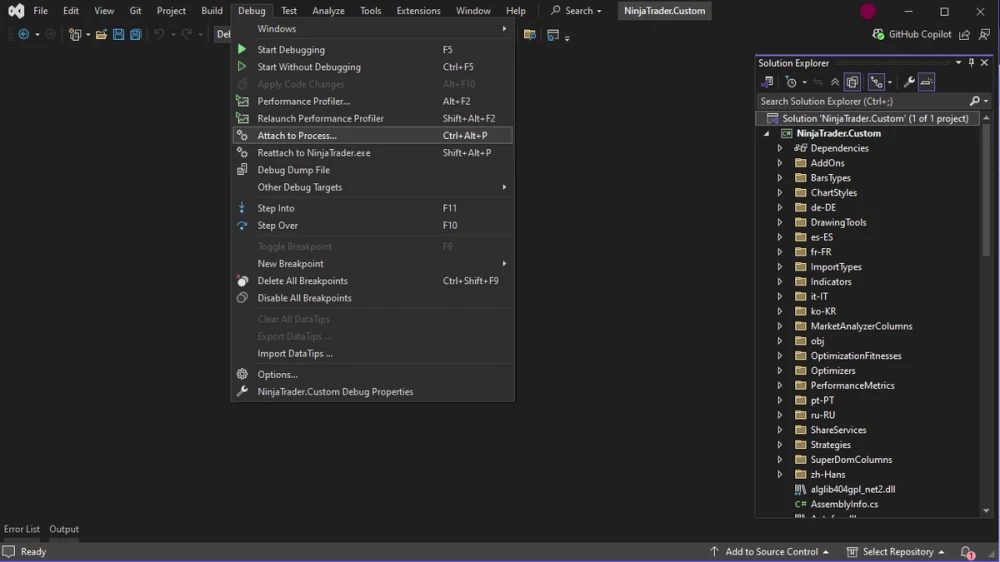
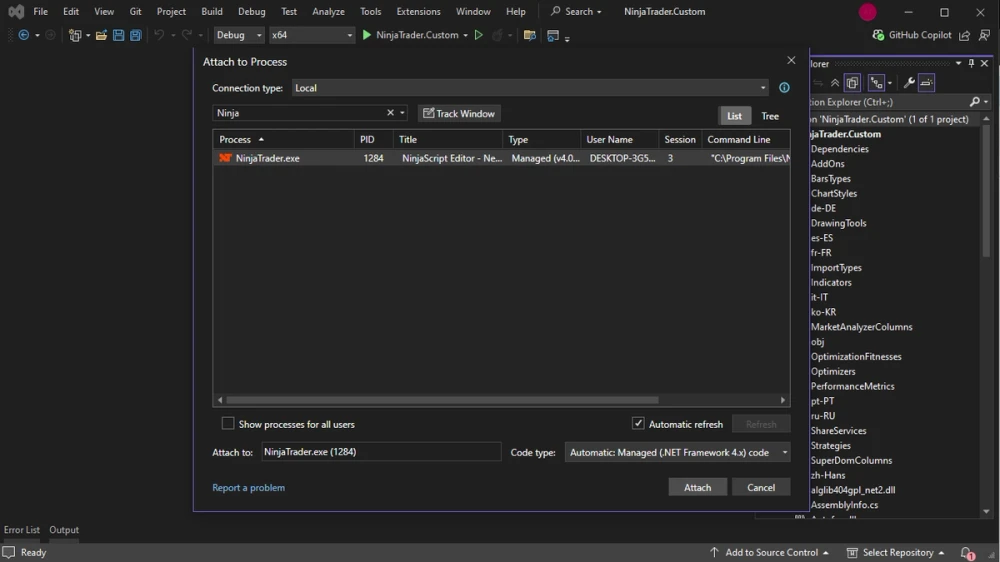
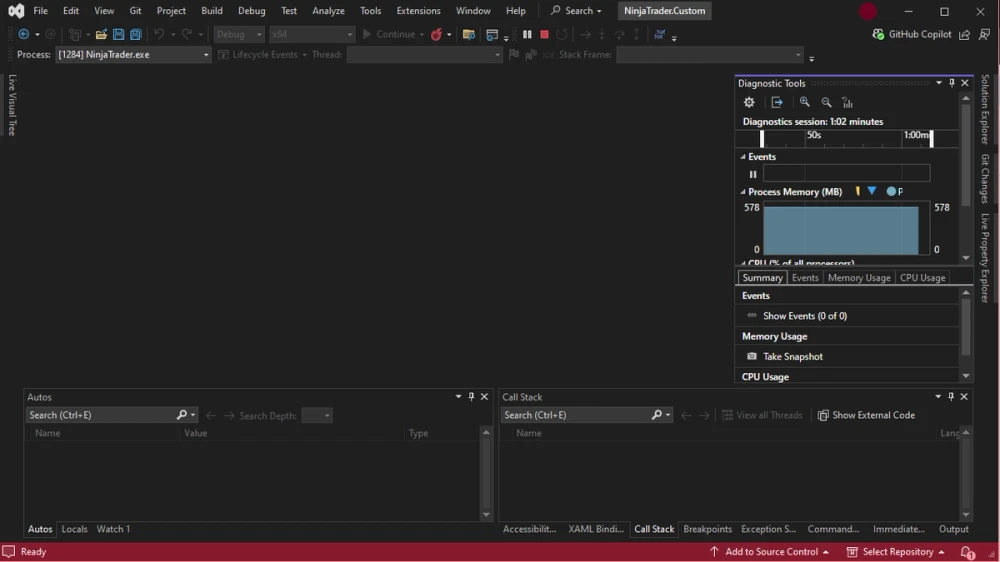
1. Attach Visual Studio to NinjaTrader:
- In Visual Studio, go to Debug > Attach to Process.
- Select NinjaTrader.exe.
- Once you see the corresponding metrics in Visual Studio, it means that you are already attached to the NinjaTrader process.
2. Run the Indicator Again:
- Press F5 on the chart in NinjaTrader to start the indicator.
3. Observe the Breakpoint Behavior:
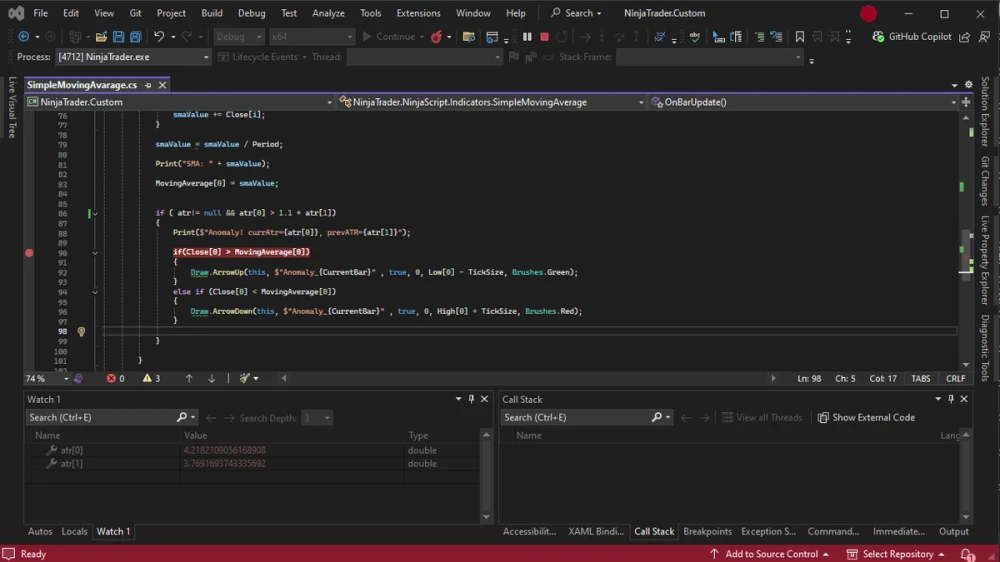
- Visual Studio will immediately open and stop at the exact line with the error.
- A tooltip will indicate the problem.
- In this mode, you can inspect surrounding variables and check their values at the moment of failure.
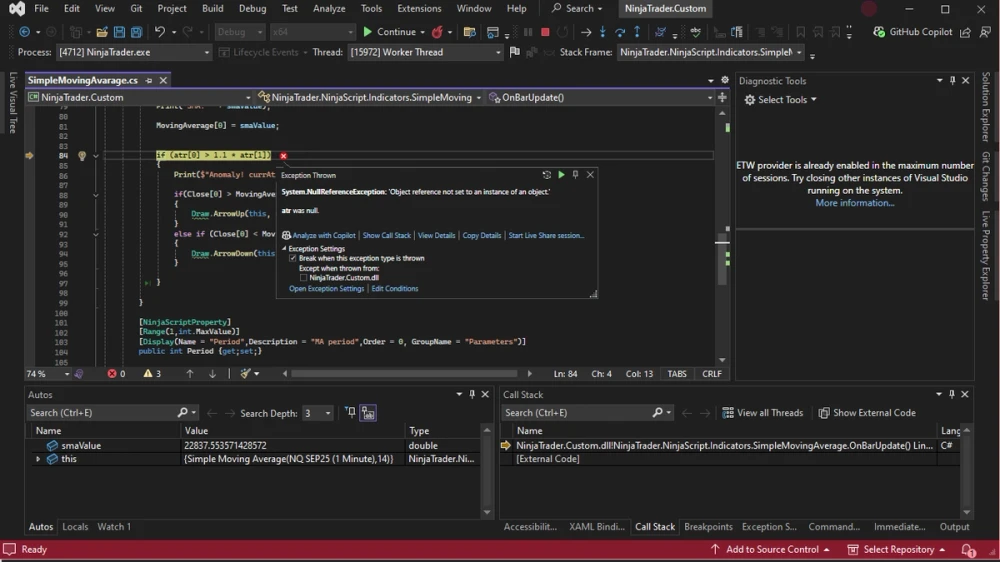
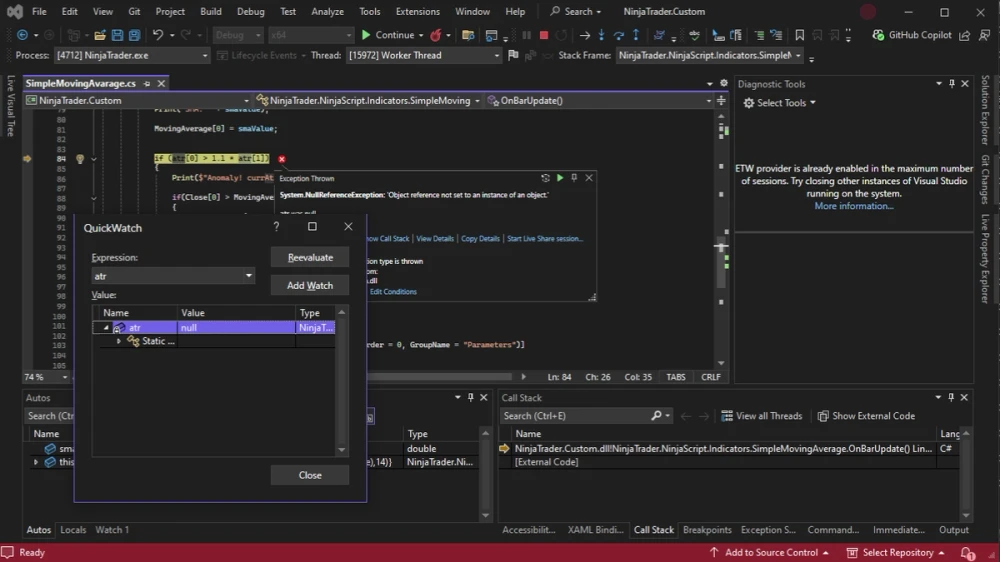
Analyzing the Error
In our case, Visual Studio shows that the atr indicator is null — meaning it was never initialized.
To fix this:
- Initialize the
atrindicator in theOnStateChangemethod, specifically in theState.DataLoadedstate. - Additionally, check for
nullbefore using the indicator to avoid runtime errors.
This is a common error — any user-created class could cause the same issue if it’s not properly initialized before usage.
Let’s update the code by properly initializing the ATR indicator and adding validation conditions to ensure it’s ready for use before any calculations are performed.
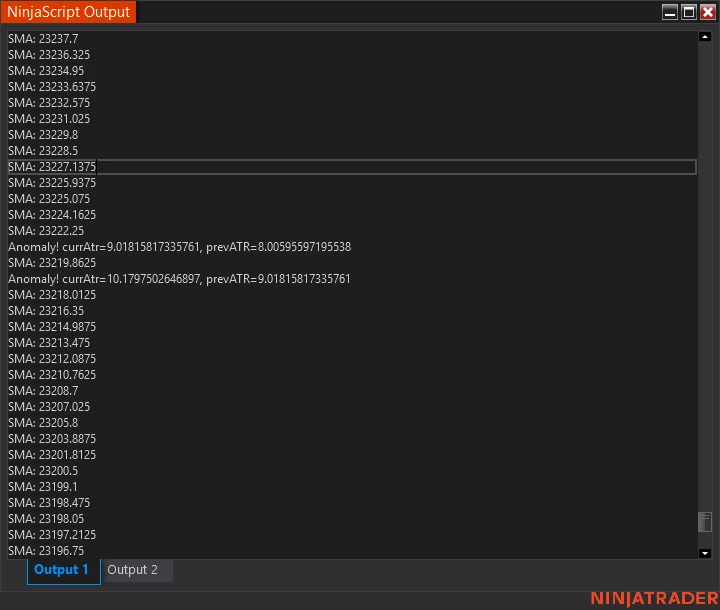
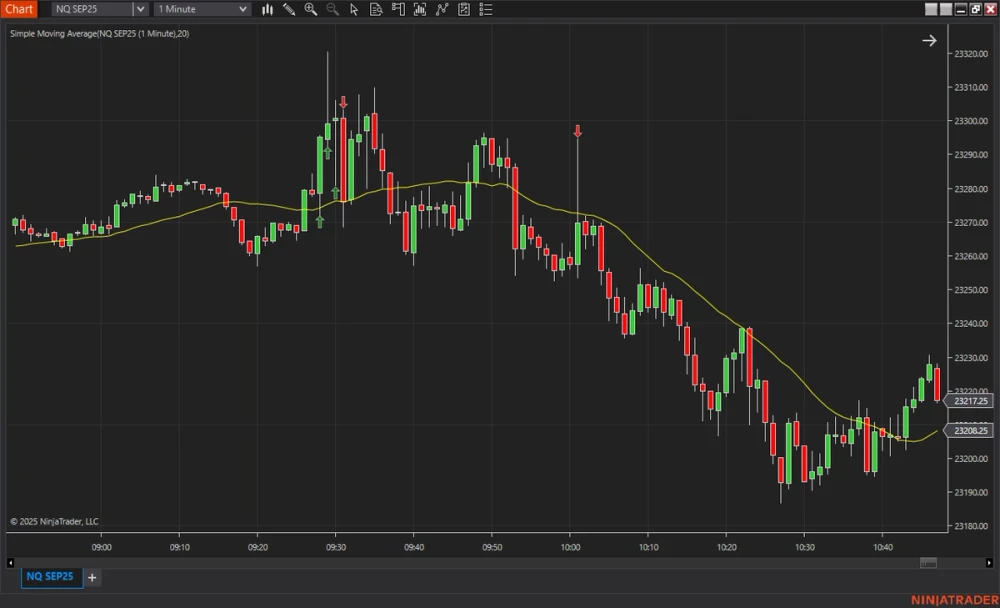
The error is now visibly fixed. Information about anomalies is now printed to the output, and these anomalies are also visually displayed on the chart.
But what if we want to pause execution at a specific line of code — even when no errors occur — to inspect the data without relying on Print() or other logging methods?
To achieve this, simply:
- Select the line where you want the code to stop.
- Click on the left margin of the editor to set a breakpoint.
Let’s set a breakpoint right after an anomaly is detected, so we can examine the variable values at that exact moment.
After setting the breakpoint and restarting the indicator, we can see that Visual Studio paused execution exactly at the line we selected.
What does this let us do?
- We can inspect variables and conditions to see what values they hold at that precise moment.
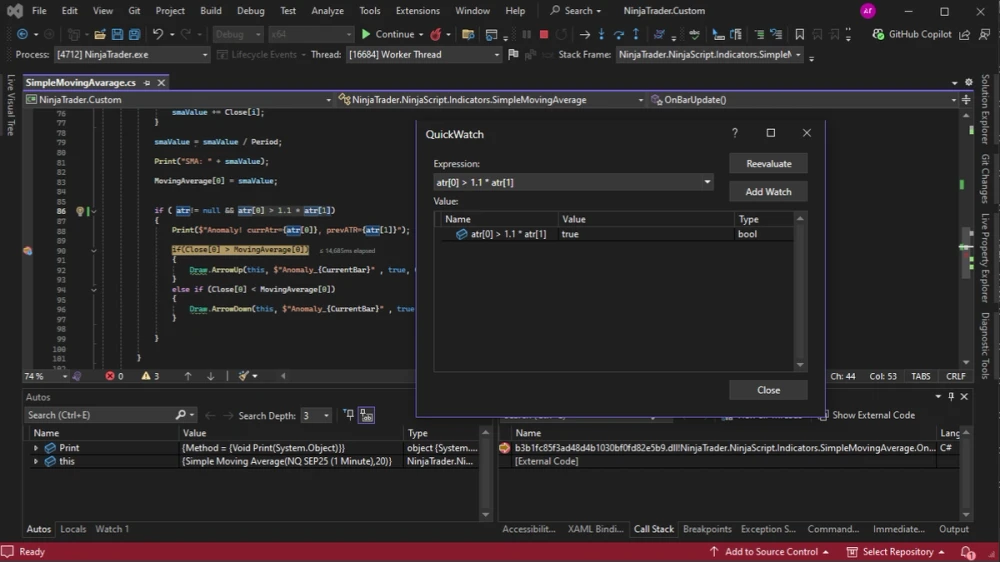
- We can track multiple values at once by adding them to the Watch window — as shown in our
atrexample.
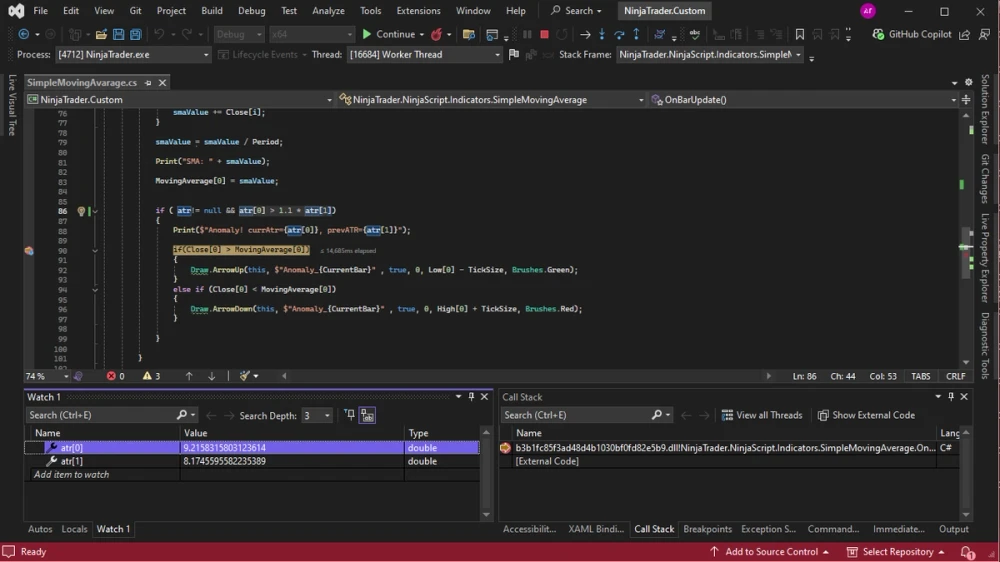
- Here, we clearly see that the current ATR is greater than the previous ATR by a factor of 1.1, which we consider an anomaly — a sharp increase in movement.
- Current ATR:
9.2158315803123614 - Previous ATR:
8.1745595582235389
- Current ATR:
- We can step through the code line by line or dive into methods and functions using F10 (Step Over) and F11 (Step Into), observing the process without rushing.
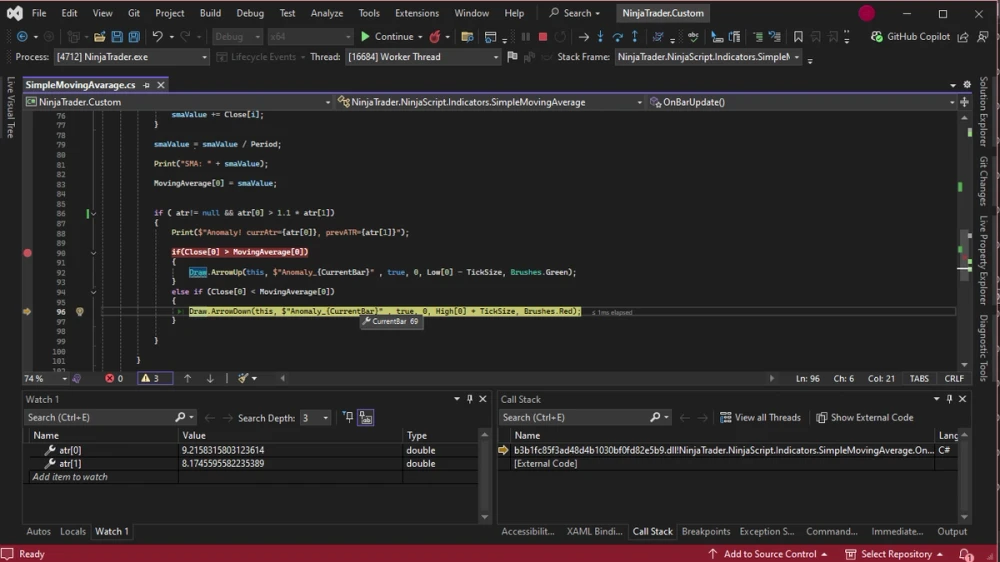
This approach provides a complete picture of what’s happening in the code at any given moment.
Pro Tips for Smarter Debugging
Visual Studio offers different types of breakpoints, each represented by unique icons in the margin. They have different capabilities and are great for different debugging scenarios:
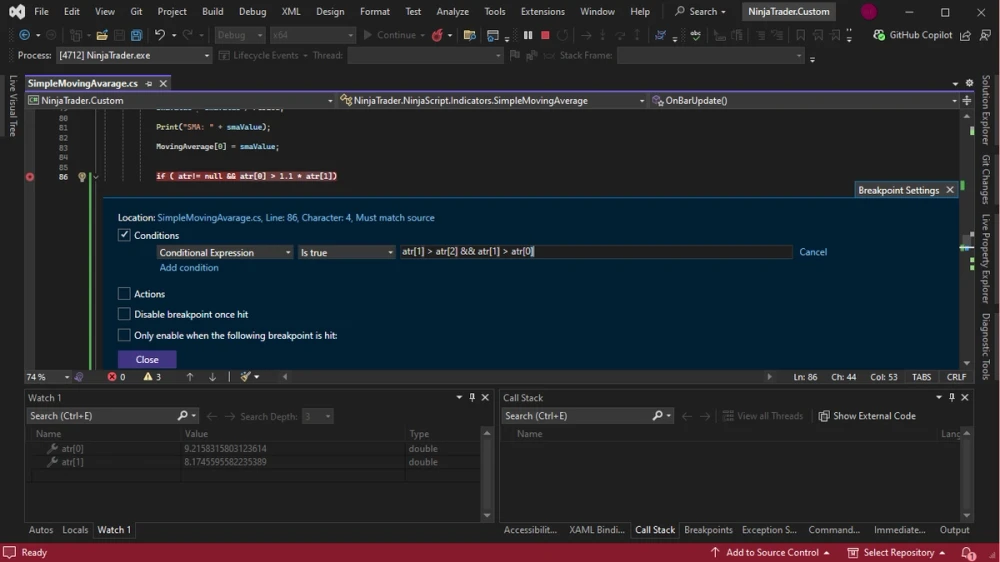
1. Conditional Breakpoints
A conditional breakpoint triggers only when a certain expression evaluates to true.
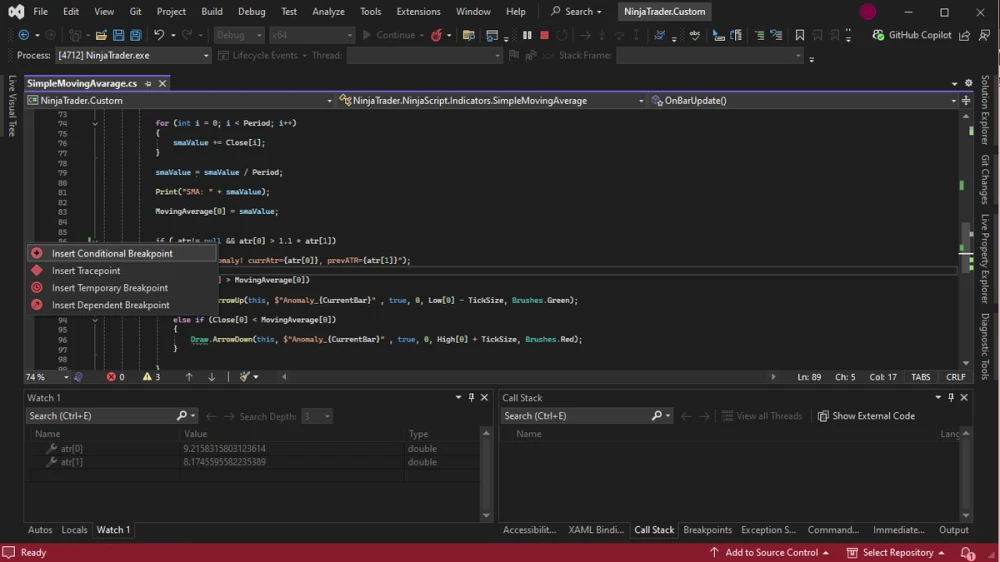
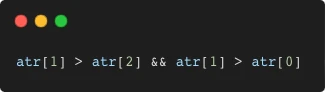
For example, to stop execution when the previous ATR is more than 2 bars back and exceeds the current ATR, you can use:
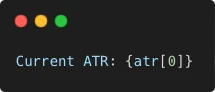
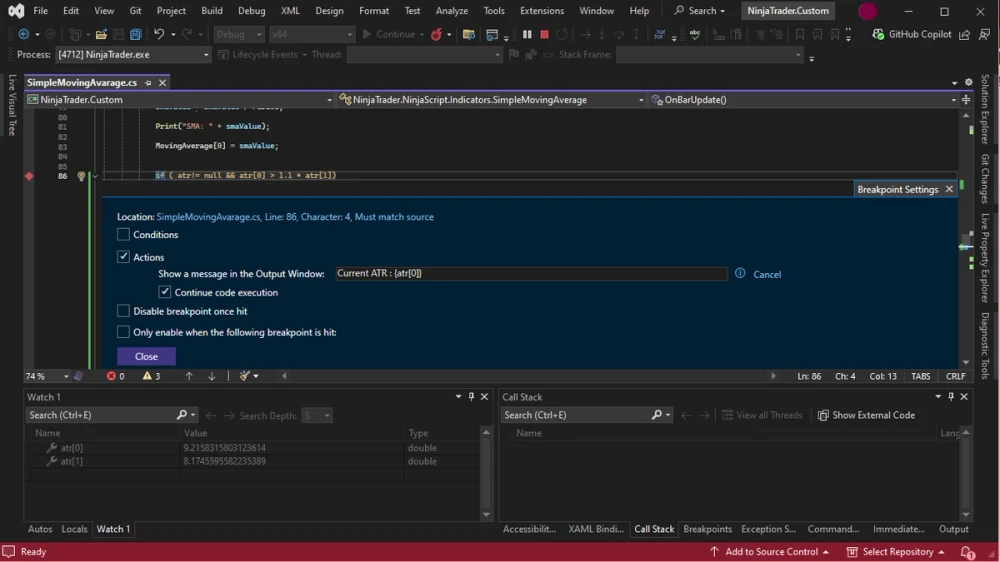
2. Tracepoints
A tracepoint acts like a Print() statement but without modifying your code.
For example, you can set a tracepoint to log:
Step 5 Summary
In this step, we explored how to use Visual Studio breakpoints effectively:
- We learned to set regular breakpoints to pause execution at the exact line of code we need.
- We used step-by-step navigation (F10, F11) to follow the logic line by line and dive into methods.
- We inspected variable values in the Watch and Locals windows to understand what the script is doing at each moment.
- We discovered conditional breakpoints for stopping execution only under specific conditions, and tracepoints for logging data without pausing.
By combining these tools, we can achieve deep, precise debugging and gain a complete understanding of the code’s behavior — from identifying anomalies to validating the correctness of logic and data at runtime.
Step 6: Tracing the Call Stack and Measuring Performance
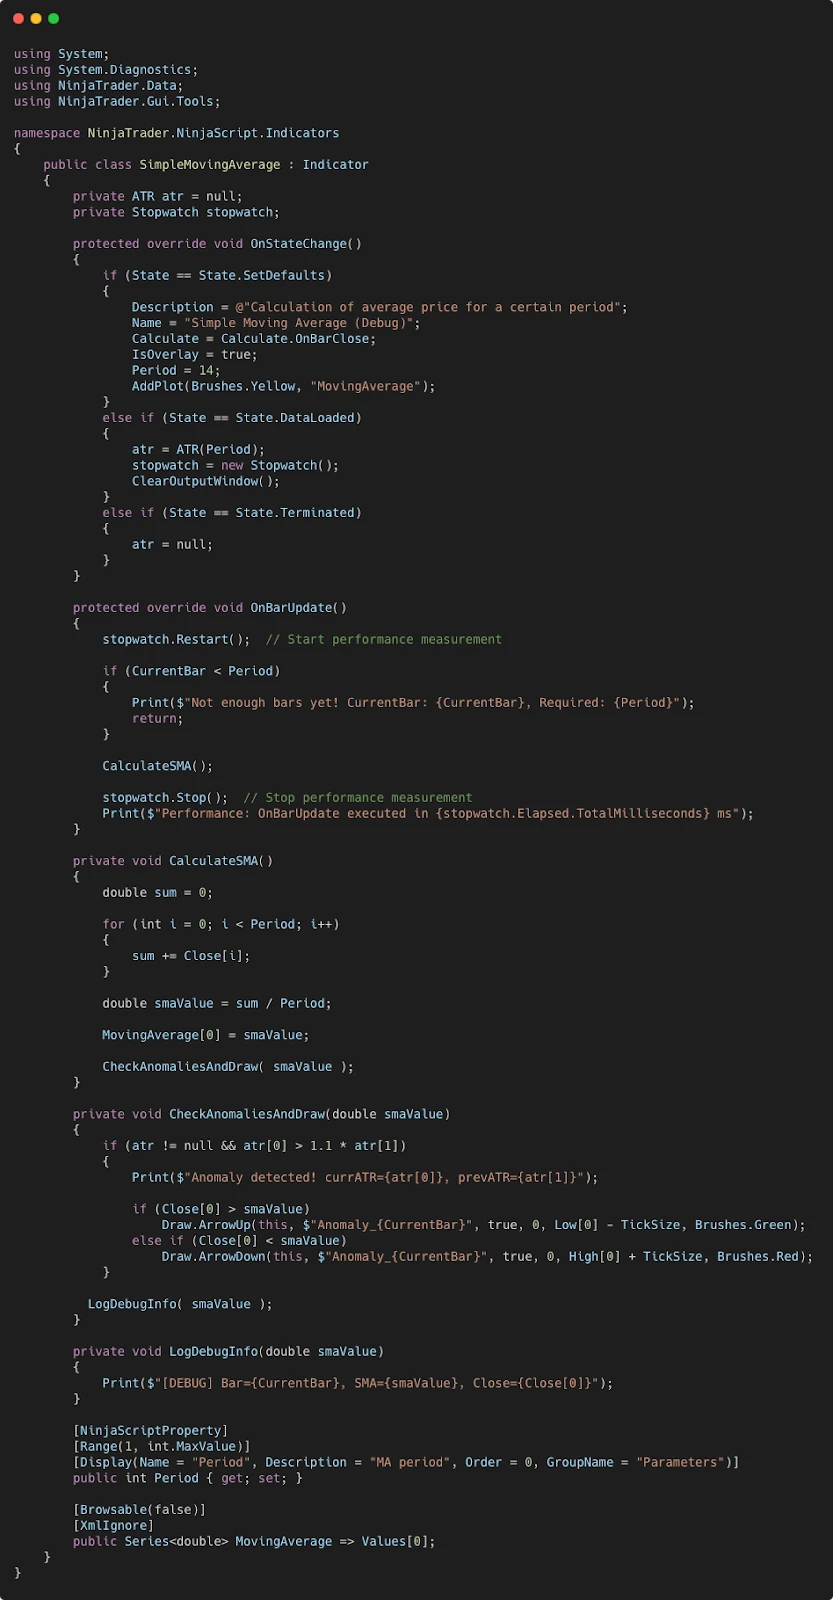
When debugging and optimizing indicators, it’s not enough to just detect errors — we also need to understand how the code flows through various methods and how efficiently it performs calculations. In this step, we’ll enhance our existing SMA indicator with method chains to visualize the call stack and performance tracking using Stopwatch.
Refactored SMA Indicator
To make our code cleaner and easier to debug, we divided it into three main methods that are nested within each other:
CalculateSMA()– handles the moving average calculation.CheckAnomaliesAndDraw()– checks ATR conditions and draws signals.LogDebugInfo()– logs key values usingPrint()for debugging.
Understanding the Call Stack
Complex scripts often involve multiple layers of method calls, making it difficult to determine how the program reached a certain point in execution. To illustrate this, we’ve expanded our indicator by splitting the SMA calculation logic into several smaller methods:
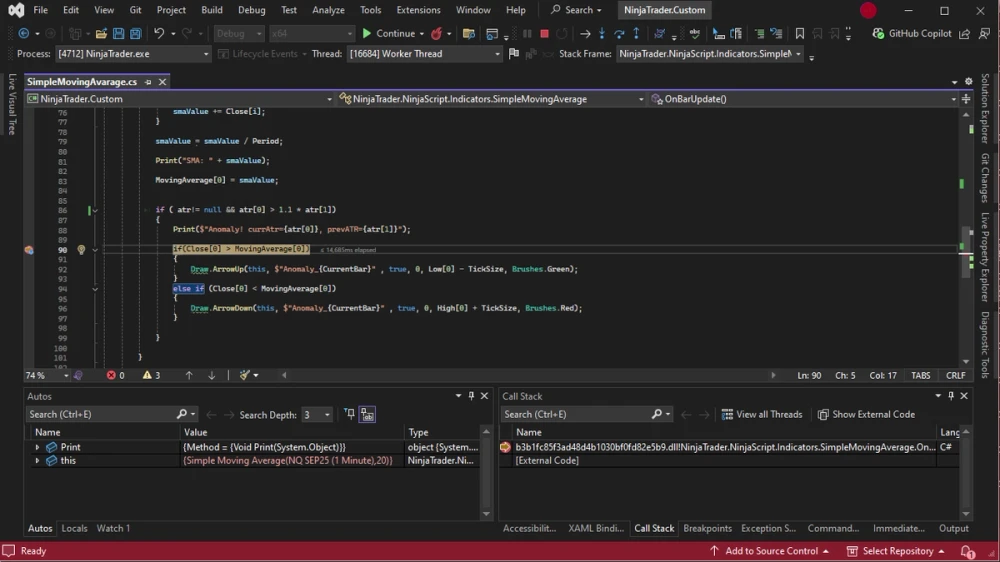
Let’s set a breakpoint inside our last method, LogDebugInfo(), and run the indicator. When Visual Studio stops at this breakpoint, open the Call Stack window (Debug > Windows > Call Stack).
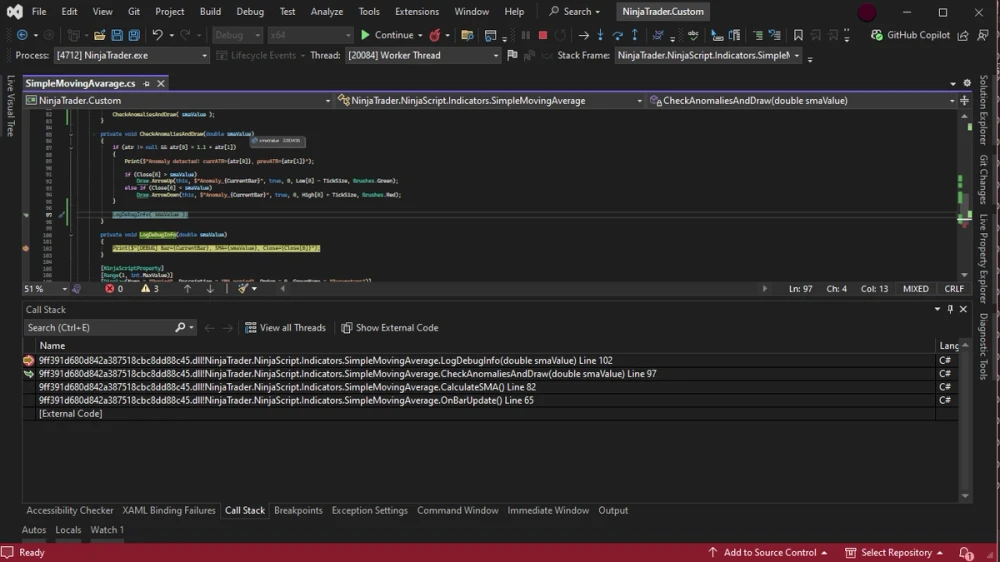
The Call Stack window displays, line by line, all methods that led to the current method’s execution.
This window allows you to easily navigate through the methods and review the entire call chain. It is an invaluable tool for debugging and understanding the execution flow, especially when dealing with complex scripts that consist of many methods and nested calls.
Performance Measurement
To evaluate how efficiently the indicator runs, we use the Stopwatch class from the System.Diagnostics namespace. This class allows us to accurately measure execution time for any code block or method.
Key Methods for Timing
The main methods of Stopwatch we use are:
stopwatch.Restart();– Starts or resets the timerstopwatch.Stop();– Stops the timerstopwatch.ElapsedMilliseconds();– Returns elapsed time in milliseconds
These calls should be wrapped around the logic you want to measure. For example:
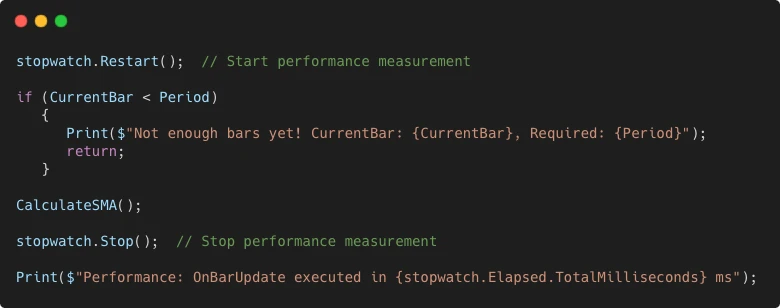
Why Wrap Around the Logic?
By placing Stopwatch.Restart() before the calculation and Stopwatch.Stop() immediately after, you ensure that only the relevant code block is timed.
This approach avoids measuring unrelated overhead, giving you accurate insight into which parts of your indicator consume the most time.
Output Example
The measured execution time is printed to the NinjaScript Output window:
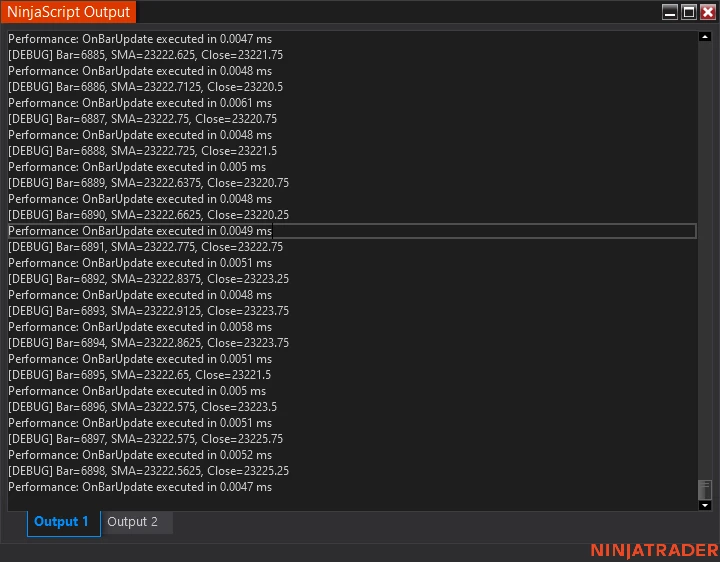
The performance output clearly shows the total execution time of the entire OnBarUpdate() method.
From time to time, you may notice differences in the reported times. This happens because some OnBarUpdate calls did not trigger the anomaly condition and therefore did not draw anything on the chart, while others executed the additional drawing logic, which naturally takes more time.
This method is most useful when you suspect that certain parts of your logic are slowing down the indicator and affecting its usability. By wrapping specific sections of code with Stopwatch, you can pinpoint which methods are taking too long to execute. This insight will help you rethink and optimize your logic for better performance.
Wrapping Up: Smarter Debugging, Better Performance
Debugging in NinjaTrader 8 is not just about fixing errors — it’s about gaining a deep understanding of how your code behaves under real market conditions.
In this guide, we walked through the entire debugging process, from simple Print() statements and guard clauses to advanced breakpoints, Call Stack analysis, and performance measurement using Stopwatch.
By splitting logic into smaller, focused methods, we’ve made our code:
- Easier to read and maintain.
- More transparent for debugging.
- Ready for performance optimization.
Key Takeaways
- For quick output, use
Print().
Use it for fast, temporary checks during development. - For critical errors or structured debugging, use
Log()orOutput.Process()to send messages to the second NinjaScript Output tab, which keeps error logs more organized. - For collecting and analyzing historical data or custom debug information, write to a file (e.g., using
System.IO.File.AppendAllText), so you can review logs even after NinjaTrader restarts. - Leverage Visual Studio’s breakpoints, conditional stops, and the Call Stack window to trace execution flow.
- Monitor execution times with
Stopwatchto detect and optimize slow parts of your code. - Keep your logic modular — this makes both debugging and future enhancements simpler.
Download the Complete Indicator
You can download the fully debug-ready Simple Moving Average with ATR anomaly detection here:
